> For the complete documentation index, see [llms.txt](https://docs-jmapserver-lima.k2geospatial.com/llms.txt). Markdown versions of documentation pages are available by appending `.md` to page URLs; this page is available as [Markdown](https://docs-jmapserver-lima.k2geospatial.com/e/applications/jmap-ng-user-guide/the-data/the-layers-panel.md).
# The Layers Panel
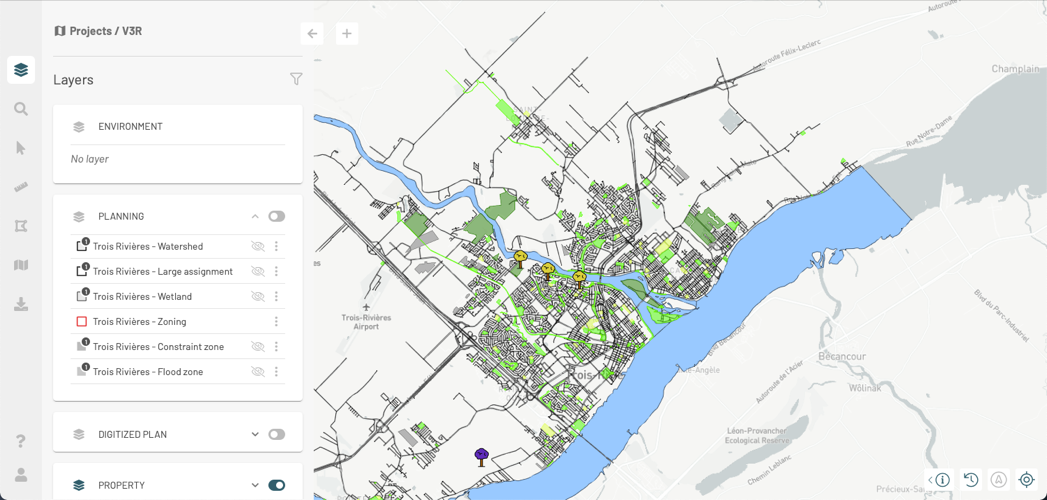
The **Layers** panel contains the details of the project's layers and tools for different functions such as controlling the display or making the elements of a layer selectable.
1. Click on to open the **Layers** panel. The icon changes color.
Within a project, groups of layers appear in the panel in the form of cards. A group can be opened to display its subgroups and layers, or it can be closed to show only its name.
2. Click on in the card of a group to open it. The subgroups and layers it contains will be displayed.
Each subgroup and layer has a card that presents different functions and details of the subgroup or layer. A subgroup is displayed using the icon, and a layer is displayed using an icon representing its style.
3. Click on to open the subgroup card and display the layers it contains. The icon changes to , indicating that the subgroup has been deployed.
4. Click on to close the subgroup card.
5. Click on to close the group of layers card.
6. Pass the mouse over a layer to display the available tools. The [Data Layers](/e/applications/jmap-ng-user-guide/the-data/data-layers.md) section offers details on these tools.
7. Select a base map from the BASE MAP group. The name of the selected map is displayed with the name of the group.
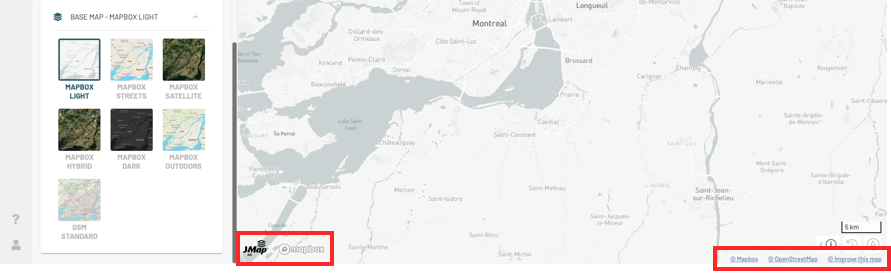
The base map attributions display at the bottom of the map.
## Filtering layers
To speed up the identification of the layers that interest you, you can apply a filter.
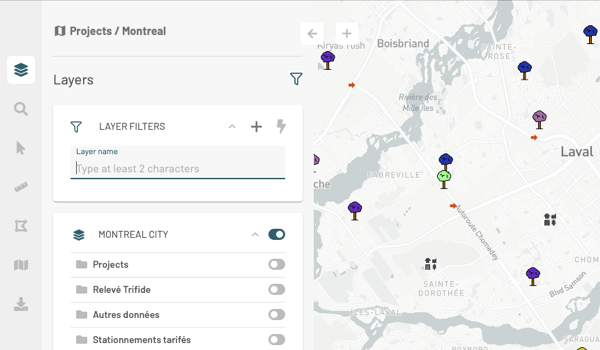
1. Click on to open the function **Layer filters**.
2. Enter characters in the range **Layer Name** to filter the layers based on their name.
3. Click on to open the **Add a filter** card.
4. Select the attribute from the **Filter by** list, the operator from the **Operator** list, and the value by which you want to filter the layers.
5. Click **Add**. The filter is displayed in the **Layer filters** box. Only the layers that pass the filter are displayed in the **Layers** panel.
6. Click on to apply the filter to the map. Only the layers which pass the filter and whose display is activated are displayed in the map.
7. Click on to remove the layer filter. The layers appear in the **Layers** panel. You must turn on the display of layers to view them in the map.
 to open the **Layers** panel. The icon changes color.
 in the card of a group to open it. The subgroups and layers it contains will be displayed.
Each subgroup and layer has a card that presents different functions and details of the subgroup or layer. A subgroup is displayed using the
in the card of a group to open it. The subgroups and layers it contains will be displayed.
Each subgroup and layer has a card that presents different functions and details of the subgroup or layer. A subgroup is displayed using the  icon, and a layer is displayed using an icon representing its style.
3. Click on
icon, and a layer is displayed using an icon representing its style.
3. Click on  , indicating that the subgroup has been deployed.
4. Click on
, indicating that the subgroup has been deployed.
4. Click on  to close the group of layers card.
6. Pass the mouse over a layer to display the available tools. The [Data Layers](/e/applications/jmap-ng-user-guide/the-data/data-layers.md) section offers details on these tools.
7. Select a base map from the BASE MAP group. The name of the selected map is displayed with the name of the group.
to close the group of layers card.
6. Pass the mouse over a layer to display the available tools. The [Data Layers](/e/applications/jmap-ng-user-guide/the-data/data-layers.md) section offers details on these tools.
7. Select a base map from the BASE MAP group. The name of the selected map is displayed with the name of the group.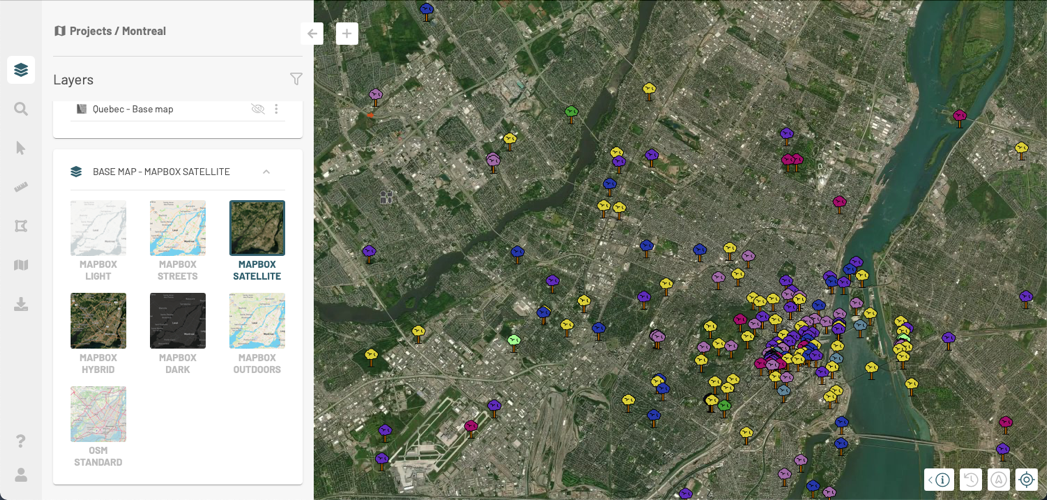
 to open the function **Layer filters**.
 to open the **Add a filter** card.
4. Select the attribute from the **Filter by** list, the operator from the **Operator** list, and the value by which you want to filter the layers.
5. Click **Add**. The filter is displayed in the **Layer filters** box. Only the layers that pass the filter are displayed in the **Layers** panel.
to open the **Add a filter** card.
4. Select the attribute from the **Filter by** list, the operator from the **Operator** list, and the value by which you want to filter the layers.
5. Click **Add**. The filter is displayed in the **Layer filters** box. Only the layers that pass the filter are displayed in the **Layers** panel.
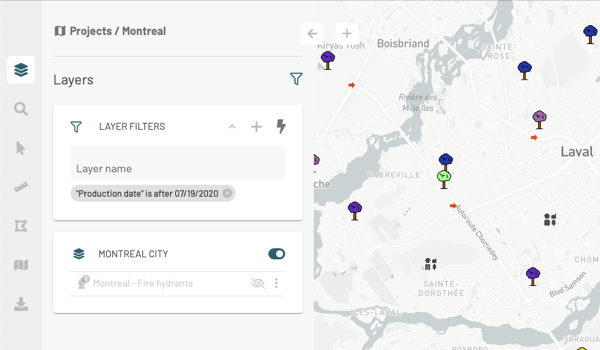
 to apply the filter to the map. Only the layers which pass the filter and whose display is activated are displayed in the map.
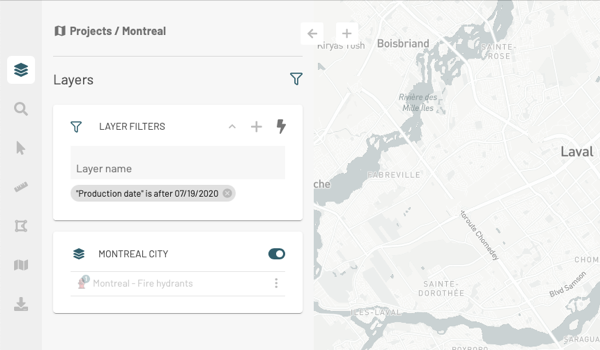
 to remove the layer filter. The layers appear in the **Layers** panel. You must turn on the display of layers to view them in the map.