The following tools allow you to navigate on the map.
Zoom extent Adjust map in order to display the whole of a project's data.
Zoom initial bounds Returns to the view that was displayed upon opening the project.
Zoom in Click on desired area of map to enlarge by a factor of 2. Trace a rectangle to enlarge the chosen area.
Zoom out Click on desired area of map to decrease size by a factor of 2. Trace a rectangle to decrease size around the chosen area.
Pan Move map by dragging it with the mouse. Click to center map view around the desired point.
Backward Return to previous view (the last 64 views are memorized).
Forward Return to the view that was displayed before clicking on Backward (last 64 views are memorized).
Zoom to selection When objects are selected, adjusts map in order to display all selected data.
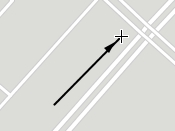
Rotation by points Define map orientation by tracing a line defined by 2 points. The first point determines the orientation of the bottom portion of the map and the second point (pointed by the arrow) determines the orientation of the top of the map.
Apply default map rotation Cancels map rotation and returns map to its normal orientation.
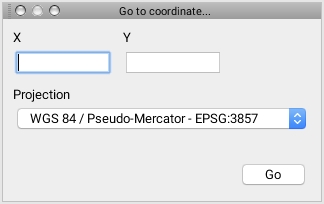
It is possible to reach specific coordinates on a map.
Click on the coordinates that appear in the status bar to display data entry window or select Tools -> Go to coordinate... or press CTRL-G.
If desired, select the coordinate system (projection) to be used.
Enter coordinates to be reached.
Press Go.
The map centers itself around the requested coordinates, which are indicated by an arrow-shaped marker.
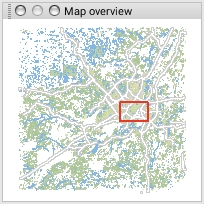
The map overview can be used to navigate on the map. In order to display it:
Go to View -> Map overview or press CTRL-O. Once it is activated, the map overview is saved in the user's parameters.
Click in the map overview to re-center the map around the desired position.
Drag the red rectangle to change the area displayed on the map.
Once enabled, the overview state remains saved in the user settings.
You can copy the pointer coordinates to the clipboard. To do this:
Position the pointer at the desired location and right-click to display the context menu.
Click Copy coordinates... to display the available projection systems.
Select the projection system by clicking on it. The coordinates are copied to the clipboard. You can copy them wherever you want.
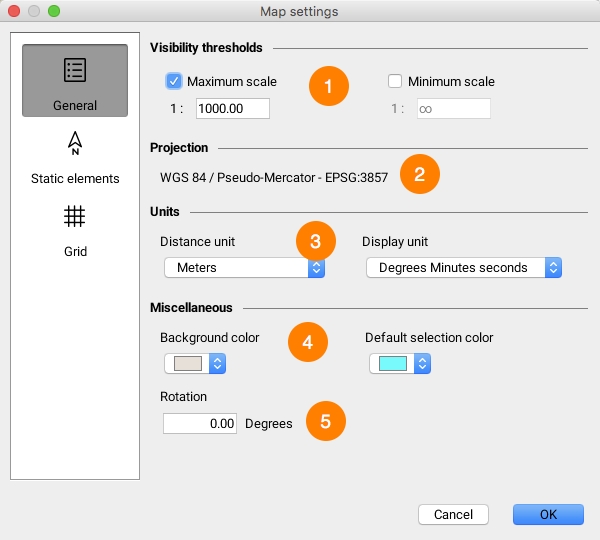
Map settings allow you to define map display options, such as rotation, units, use of a north arrow, and so forth. Map settings can be accessed from the map's pop-up menu (right-click on map).
1
Scale limits are used to limit the map's display scale. This prevents users from zooming too far in or out. Maximum scale: Maximum scale limit for zooming in on the map. Minimum scale: Minimum scale limit for zooming out on the map.
2
Application's map projection system.
3
Select units used on the map. Distance unit: The distance unit is used to display all distance-related values (measurements, zoom level, etc.). Display unit: Unit used to display map coordinates.
4
Background color: Select background color for map window. Background color appears wherever there is no visible data. Default selection color: Select default selection color. Selected objects will be of this color unless a different selection style is defined for their layer.
5
Enter rotation used to display map, in degrees. Rotation is performed clockwise.
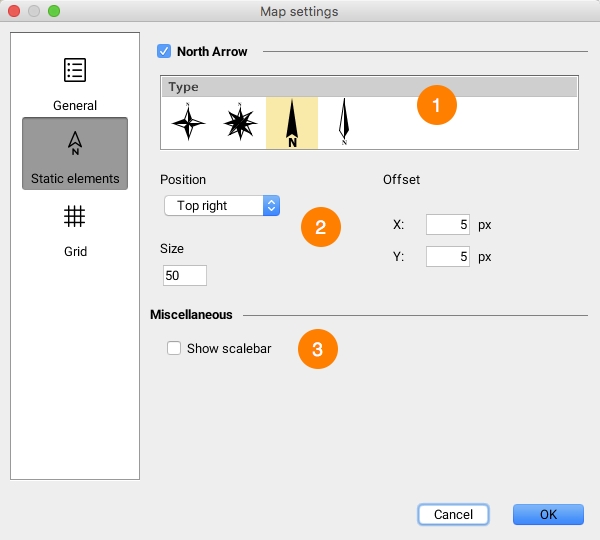
Static map elements are objects that are placed on fixed areas of the map. Two types of static elements are available: the north arrow and graphic scale.
1
Select the North Arrow option to enable the display of the north arrow on the map. Afterwards, select the arrow model you wish to use. If the map is rotated, the north arrow will indicate this rotation.
2
Select the arrow's position on the map. You can also offset the arrow from the chosen position by entering values in pixels. In addition, the size of the arrow can be adjusted.
3
Enable the graphic scale to be displayed by selecting this option.
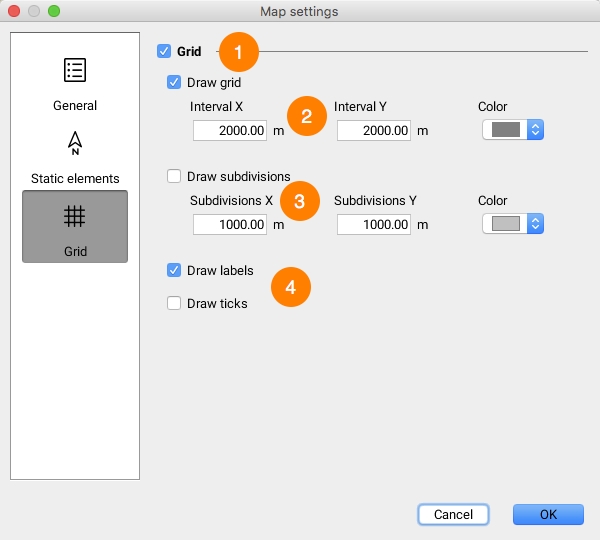
A grid can be added to the map. This grid shows divisions and subdivisions of the coordinates system.
1
Activate the grid.
2
Select this option to have the grid show the division lines. Specify the X and Y intervals between the lines in the grid. You can also select the color of the division lines.
3
Select this option to have the grid show the subdivision lines. Specify the X and Y intervals between the subdivision lines. You can also select the color of the subdivision lines.
4
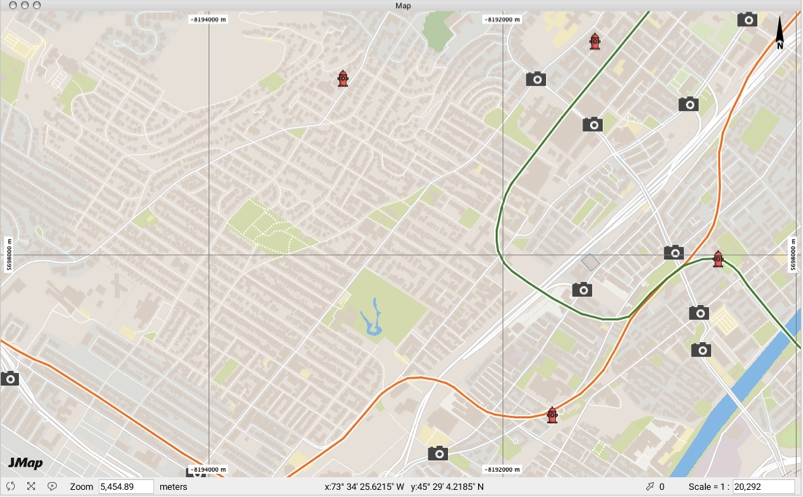
You can add labels indicating the grid's coordinates and ticks on the edges of the grid (view image below).
JMap Pro's graphical interface is modular (note that there is also a simplified version of JMap Pro that does not permit the user interface to be reorganized).
Each window can be moved to provide a customized interface. To move a window, you must click on the top portion of it, then drag and drop it to the desired area. You may want to hold down the CTRL key when moving a window to avoid automatically dropping it onto the sides of the application.
Most windows include a set of display options located in their upper right corner, allowing you to toggle to floating mode, to enable auto-hide, and to close the window.
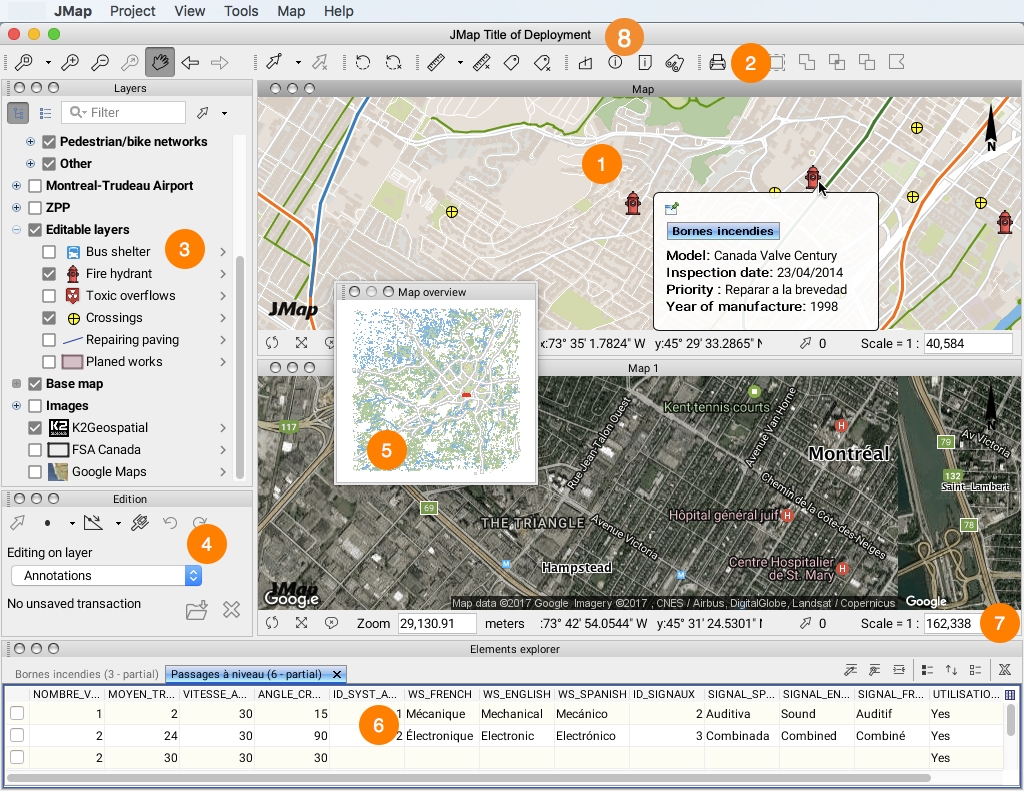
The following illustration shows the main parts of the interface.
1
Map displaying a portion of data. It is possible to open several maps at once and organize them according to your needs. Each map is independent from the others. Maps are interactive and allow for easy querying of objects.
2
Toolbars and menu bars allow you to access the application's various functions.
3
The layer management window displays a hierarchical structure of the project's layers. You may turn layers on or off as needed.
4
5
The map overview shows the region displayed on the map in relation to the entire territory. It also allows you to access a region in a single click. The overview can be activated from the View menu.
6
The elements explorer displays a tabular view of a layer's data or of selected data. The table is interactively connected to the map.
7
Each map has a status bar indicating the coordinates, the scale, the number of selected elements, etc.
8
The name of the deployment may appear in the title bar.
Extensions can be added to JMap to provide new functionalities. For example, the extension adds functionality to create and modify data.
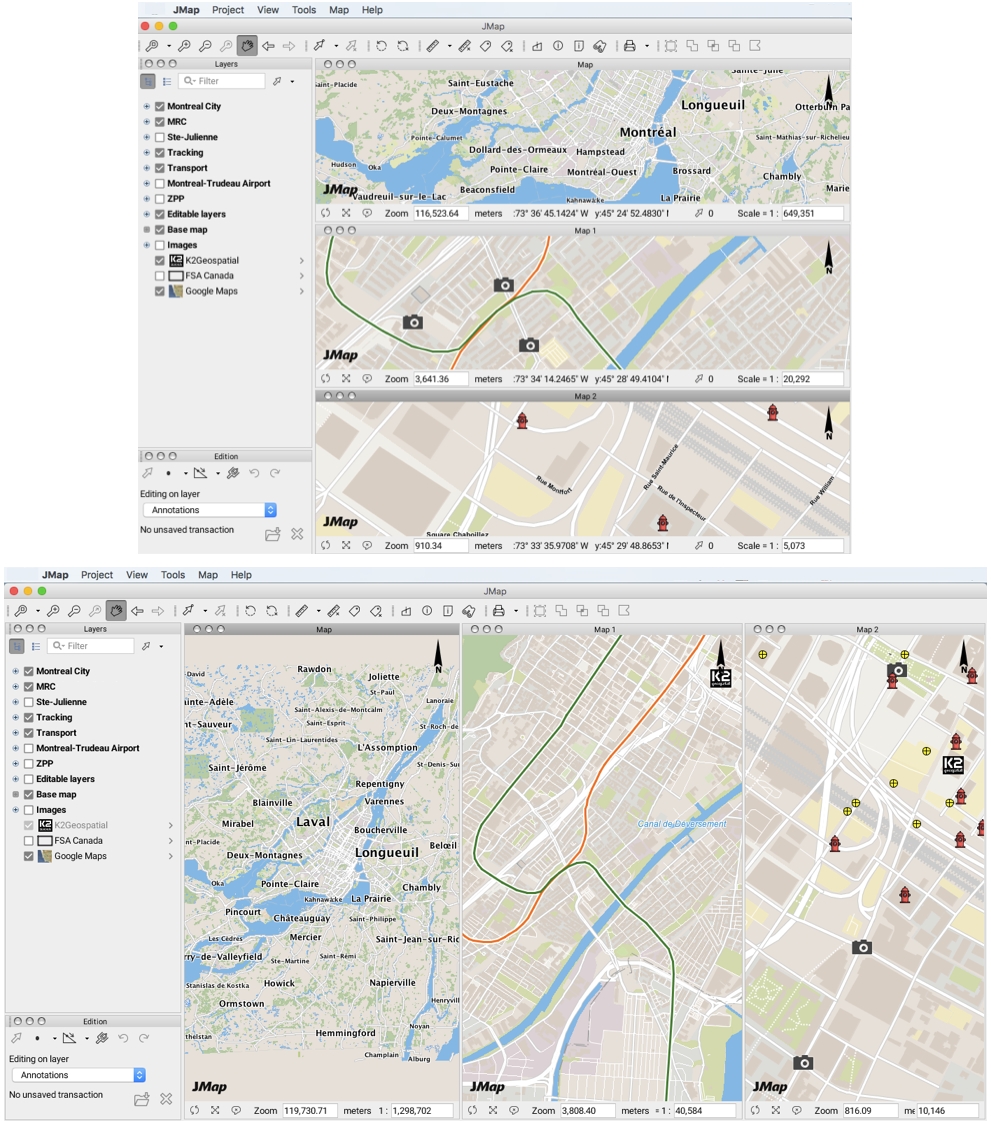
JMap Pro allows you to open several maps simultaneously; each map is independent from the others. Thus, you can navigate in each map and display or hide layers in one map or another. Maps can be piled one on top of the other or placed side by side to be viewed simultaneously.
Each map has a title, which is displayed on the title bar of the map window.
To open a new map go to Map -> New map or press Ctrl-N.
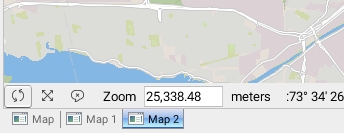
The new map opens and is placed over the current map. Maps that are piled this way are accessed by clicking on the tabs displaying the titles of each map.
To move a map:
Select it by clicking on its title bar or its tab.
Drag and drop it to the desired area.
Maps must be placed close to the sides of the application window.
To organize several maps:
Place a map directly on another to pile them one on top of the other.
OR
Select Map -> Tile maps horizontally or Map -> Tile maps vertically or Map -> Group maps to organize maps according to your desired configuration.
Map synchronization allows you to navigate on several maps simultaneously. Each action performed on a map is automatically replicated on all synchronized maps. In addition, the mouse pointer is also replicated on all synchronized maps. Synchronized maps can be useful to compare information taken at different times on the same territory.
In order to synchronize maps:
Open at least 2 maps and place them side by side.
To stop synchronization, press the button again in each map window.
Full screen view allows you to display a map occupying the entire space of the screen. All components of the graphical interface are removed except for the status bar, which remains available and is located underneath the map. The last active tool on the map remains functional. In addition, all mouse and keyboard navigation shortcuts can be used to navigate on the map in full screen mode.
For each map you wish to synchronize, press (located in the bottom left corner of each map window). All maps are automatically synchronized with the first one and remain synchronized afterwards.
To toggle between normal and full screen mode, press . You can also press Escape (ESC) to exit full screen mode.

