JMap includes several tools that provide information on map elements.
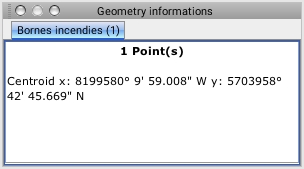
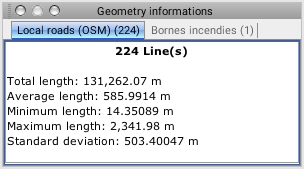
This tool allows you to obtain information on the geometry of the map's elements. The information varies according to the type of geometry (point, line, polygon, etc.) and the number of selected elements. Select one or more elements on the map and click on the button for this tool.
The figure shows the geometry information on a single map element:
The figure shows the geometry information on multiple map elements:
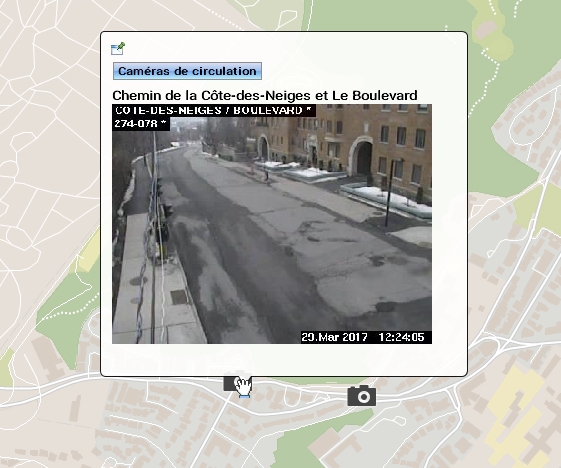
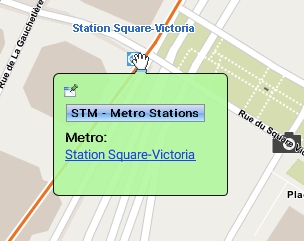
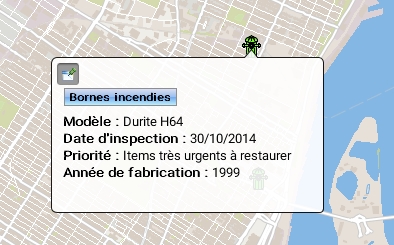
Mouseover bubbles contain information on map elements. They are automatically displayed when the mouse pointer remains on the elements of certain layers. Mouseover bubbles can contain attribute values, links to web pages, images, etc. When several elements are superimposed, mouseover bubbles display the information for all the elements, grouped by layer.
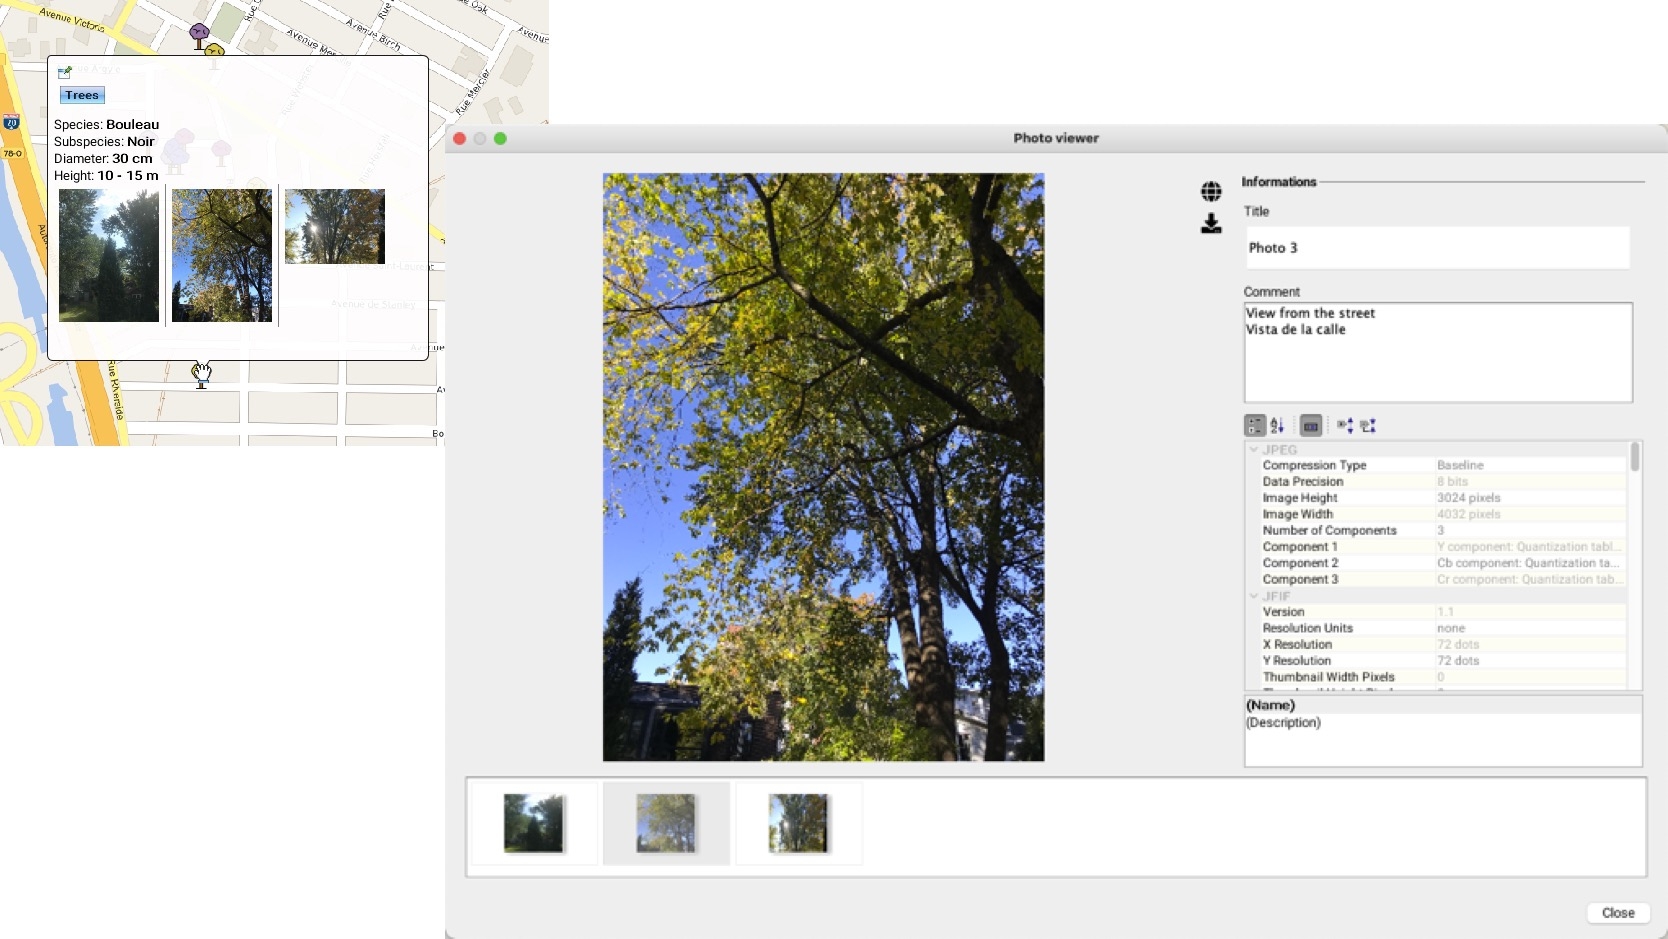
Mouseover bubbles can be used to display HTML content, images or 360 degree photos. When the mouseover contains many photos or large photos (such as 360 degree photos) it may have a delay in its display.
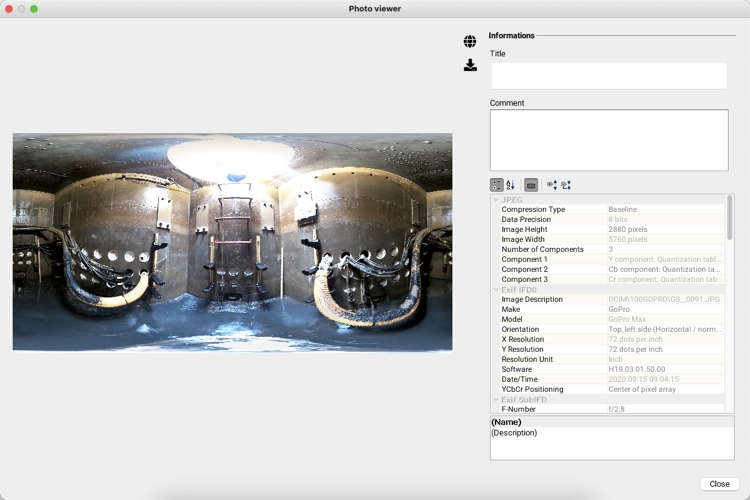
You can display the title of a photo and its comments by double-clicking on it to open the photo viewer.
The photos available for the item are displayed in the viewer. Click on the photo of your choice to display it with its information.
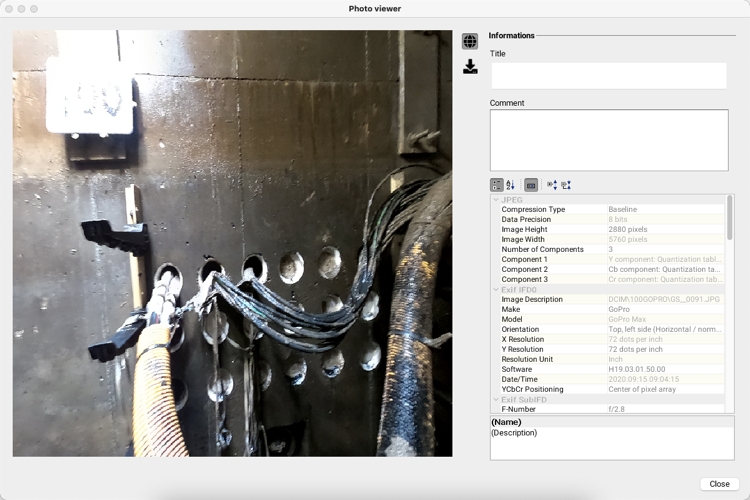
In the case of 360 degree photos, information about the photo can be displayed and you can navigate the photo.
The colour of mouseover bubbles can be configured (refer to Layer Settings). It can be different for each information layer.
Mouseover bubbles can be pinned to the screen in order to be displayed persistently. To pin a mouseover bubble, click on the icon located in its upper left corner.
You can select and copy the contents of a mouseover bubble by clicking on the icon located in its upper left corner and pasting it in another document (Word, Excel, etc.) using the Ctrl-C and Ctrl-V keyboard shortcuts.
You can also adjust the delay before the mouseover bubbles appear, according to your preferences (refer to the Application Settings section).
When the mouseover contains many large photos, it takes more time to display.
The icon allows you to display the photo in 2 or 3 dimensions. The icon allows you to download the photo.
To view the photo in two dimensions, click on . To return to the 360 degree view, click on the same icon.
You can also disable all mouseover bubbles on the map by clicking on the button located in the lower left part of the map.
This tool opens an information report related to the map elements.
Reports display descriptive data pertaining to the pointed elements. They are defined by the JMap administrator.
Enable the tool and click on one of the map's elements. If several elements of one or more layers are pointed, several reports will be available in the same window, but only one can be viewed at a time.
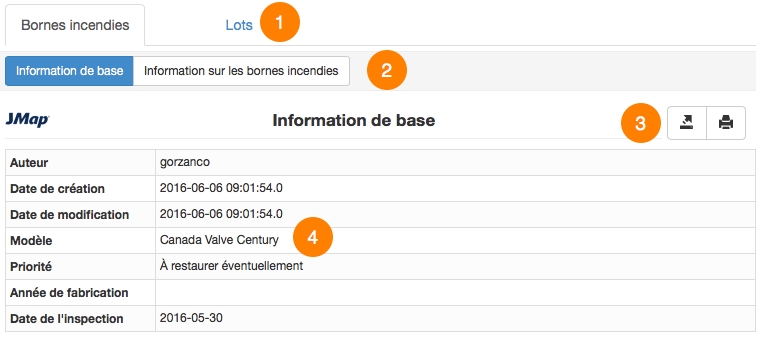
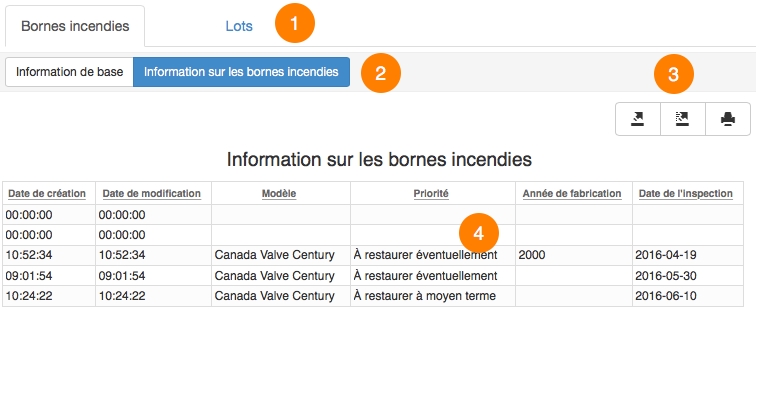
The figure illustrates information reports on two layers:
1
The top portion of the report displays the names of the layers for which information reports are available at the pointed area.
2
Clicking on a given layer allows you to view its list of available reports; the first report is automatically displayed.
3
The contents of the displayed report can be exported towards an Excel file or printed. There are also more advanced reports that allow you to export individual attributes to a CSV file.
4
Information contained in the report is configured by the JMap administrator.
It can originate from the layer itself or from other data sources associated with the map layer.
This tool allows you to open an information report containing information on all of the selected elements. Select elements and open the report by clicking on the information reports icon.
The figure shows an exemple of information report on selection:
1
The names of the layers on which selections have been performed are displayed at the top of the report.
2
Clicking on a given layer allows you to view its list of available reports; the first report is automatically displayed.
3
The contents of the report displayed can be exported in individual columns to a CSV file, exported in whole to an Excel file, or printed.
4
Information contained in the report is configured by the JMap administrator. It can originate from the layer itself or from other data sources associated with the map layer.

