Loading...
Loading...
Loading...
Loading...
Loading...
Loading...
Loading...
Loading...
Loading...
Loading...
Loading...
Loading...
Loading...
Loading...
Loading...
The Permissions button appears on the Layers tab in a project's configuration interface and is enabled when at least one layer is selected. It is also displayed in the layer's configuration interface.
This section has two tabs: Permissions and Owners. The owners are the only ones who can manage the administrative permissions for the layer, manage the list of owners and delete it.
A list of users and groups with permissions appears in the Permissions tab. Click on to add new users or groups.
Available users and groups are configured in the JMap Server section of JMap Admin. Refer to the Users and Groups section for more information about managing users in JMap Server.
Only users and groups who already have permission to open the project containing the layer can be granted permissions to that layer.
Layer permissions are divided into two categories: administrator permissions and user permissions.
Remote access
View this layer
Allows a user to view a layer in JMap’s applications.
By default, the everyone user (everyone who has permission to open the project) is authorized to view any new layer.
To restrict access to a layer, you must remove this permission from everyone and only add it to the users of your choice.
Add elements
Allows a user to add new elements on the layer and enter attribute values using the form associated with the layer.
Editing must be enabled on this layer in order for this permission to be available.
Modify elements
Allows a user to modify the geometries of the elements (move, add/remove nodes, etc.) found on the layer. Also allows the user to modify attribute values using the form associated with the layer. Editing must be enabled on this layer in order for this permission to be available.
Delete elements
Allows a user to delete existing elements on the layer. Editing must be enabled on this layer in order for this permission to be available.
Modify attribute values
Allows a user to open the form of a layer’s element attributes and to modify their values. Editing must be enabled on this layer in order for this permission to be available.
Copy / export elements
Allows a JMap Pro user to copy the data of the layer to another layer, or to export the data of the layer using the JMap Exportation extension.
Options
Edit only own elements
Allows the user of a JMap application to modify the geometries, the values of the attributes or to delete only the elements that he has created in the layer. The user cannot edit the elements of the layer that were created by other users.
Allows a user to access this layer through a JMap Server to JMap Server connection. This permission must be granted to the account of the user who established the secure connection between both JMap Servers. For more information on this topic, refer to the section.
The general settings section of a layer is available in the General tab of the layer configuration interface.
Name
The name for the layer. Names attributed to layers in the same project must be unique. By default, the name of the associated spatial data source is used.
Description
An optional text to describe the layer. In JMap applications, this text can be viewed by users in a mouseover bubble on the layer name.
Published
Visible
Determines if the layer is visible or not when the project is opened. Users can make layers visible or invisible in JMap applications.
Selectable
Determines if elements of the layer will be selectable or not when the project is opened. Users can modify selection options in JMap applications. By default, the elements of the new layers that you create are not selectable.
Show in overview
Determines if the layer will appear in the map overview, if present. This overview simplifies map navigation.
Listed
Determines if the layer will be listed in the layer manager in JMap applications. A layer that is not listed appears on the map normally.
Scale thresholds are used to control the visibility of a layer according to the scale of the displayed map. This is useful when you want to hide elements of a specific layer beyond (or under) a certain scale. For example, you might not want to display the local street layer when looking at the whole territory of a country. Using the thresholds, you could specify that the local streets are to be visible only when looking at a map with a scale greater than 1:100000. In that case, you would specify a minimum scale of 1:100000, without indicating a maximum scale.
Minimum scale
Minimum scale in order for the layer to be visible. Allows the layer to become invisible when the user zooms out too much.
Maximum scale
The maximum scale in order for the layer to be visible. Allows the layer to become invisible when the user zooms in too much.
Non modifiable
(Applies to JMap Pro only) Determines if the users are allowed to modify these values. Modifying these scales on the JMap Pro side for layers that contain a high number of elements could cause very long queries that use a lot of resources or even lead to unusual responses from the JMap Pro application or JMap Server.
The dynamic refresh of the layer is used to automatically reload the data of a layer after a configured delay, without the need for the user to manipulate the map. This can be useful for layers that contain data that is updated regularly, such as layers of vehicle tracking (AVL). This is an alternative to the use of layers by region to have dynamic data.
Dynamic
Select this option to activate the dynamic refresh.
Refresh every
Specify the delay between each refresh.
The layer configuration interface allows you to access layer information as well as parameter configuration functions such as style, labels, or reports. Tabs also provide access to the same functions.
1
2
Layer parameters configured when it was created. The hyperlink allows you to access the spatial data source that contains the layer data.
3
4
5
6
Layer visibility thresholds; shows the limits between the minimum and maximum scales for displaying layer elements.
7
8
9
10
11
12
13
The raster layer configuration interface contains the General information, Layer parameters, JMap Cloud and Visibility thresholds sections and General and Style tabs.
The Attribute configuration window contains three tabs: Metadata, Statistics, and Attribute sample.
Metadata
Type
Indicates the type of data for the attribute.
SQL Type
Indicates the SQL type of the data for the attribute.
Indexed
Check this box to have the attribute indexed.
Title
Format pattern
The Statistics tab provides simple statistics about the attribute. The Attribute sample tab displays the value of the attribute for a sample of layer elements.
Dynamic filters are used to display certain elements of the layer that match the user's criteria.
JMap Pro applications support dynamic filters for layers that load by region or tile. JMap Web applications support dynamic filters for layers that load by region.
Dynamic filters are defined using an attribute, an operator, and values for the attribute. A dynamic filter can be composed of several attributes. Operators vary depending on the attribute type.
Text-type attributes provide full or partial match operators as well as the presence of null values. Up to 2048 unique values are supported in drop-down menu mode. For attributes who have more unique values than this number, value selection is done by entering the values in the range.
Numeric type attributes offer quantitative operators.
Date type attributes provide time operators and calendars for choosing dates. Dynamic time operators can also create mobile windows from a selected date.
To create a dynamic filter:
On the Dynamic Filters tab in the layer settings interface, press to add an attribute.
Select an operator and values in the appropriate ranges. You can add as many attributes as you want. To remove an attribute from the filter, select it and click on the minus icon .
Check the Enabled box to make the dynamic filter active when a user opens an application.
Click on Save to save the dynamic filter.
Click on the filter name to open its interface and edit it.
equals: This operator filters a layer's elements to display the elements whose attribute value (regardless of its type) is equal to one of the values selected by the JMap administrator.
does not equal: This operator filters a layer's elements to display the elements whose attribute value (regardless of its type) is different from the values selected by the the JMap administrator.
greater than: This operator filters a layer's elements to display the elements whose attribute value (numeric or date) is greater than the value selected by the JMap administrator.
greater or equal to: This operator filters a layer's elements to display the elements whose attribute value (numeric or date) is greater than or equal to the value selected by the JMap administrator.
less than: This operator filters a layer's elements to display the elements whose attribute value (numeric or date) is less than the value selected by the JMap administrator.
less or equal to: This operator filters a layer's elements to display the elements whose attribute value (numeric or date) is less than or equal to the value selected by the JMap administrator.
contains: This operator filters a layer's elements to display the elements whose attribute value (text) contains the value selected by the JMap administrator.
does not contain: This operator filters a layer's elements to display the elements whose attribute value (text) does not contain the value selected by the JMap administrator. This is the same as making a query with the WHERE clause attribute_name NOT LIKE '%value%'.
is empty: This operator filters a layer's elements to display the elements whose attribute (text) does not have a value.
is not empty: This operator filters a layer's elements to display the elements whose attribute (text) has a value.
is null: This operator filters a layer's elements to display the elements whose attribute value (regardless of its type) is null.
is not null: This operator filters a layer's elements to display the elements whose attribute value (regardless of its type) is not null.
is between: This operator filters a layer's elements to display the elements whose attribute value (numeric or date) is within the range defined by the two values entered by the JMap administrator.
is not between: This operator filters a layer's elements to display the elements whose attribute value (numeric or date) is not within the range defined by the two values entered by the JMap administrator.
last: This operator filters a layer's elements to display the elements whose date attribute value is within the range (expressed in years, months, week(s), day(s), hour(s)) defined by the JMap administrator.
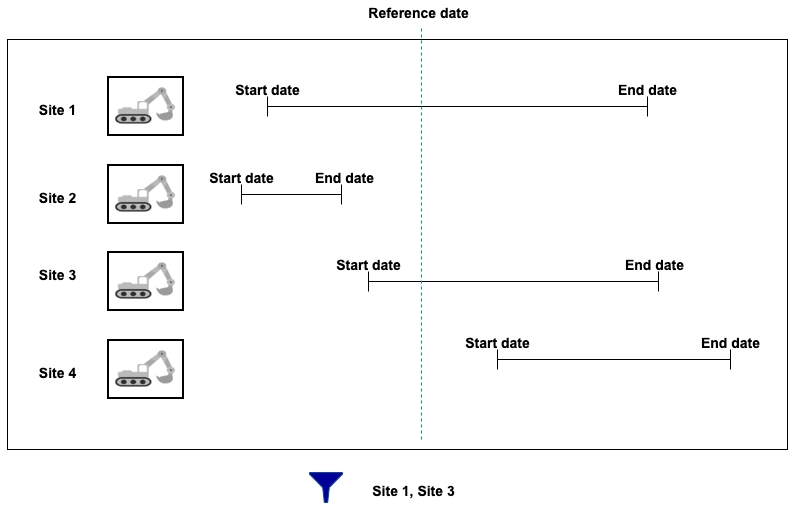
interval: This operator filters a layer's data based on time ranges defined using a start date, an end date and a reference date. The user therefore has a tool to display data that varies over time.
The layer must contain at least two date and/or timestamp attributes, one of these being the start Date/Time, and the other being the end Date/Time. The values of these dates can be NULL to indicate a start date that goes a long way back or an end date that is very far in the future.
A reference date is also needed. This date can be a specific date (in the past or in the future) or a current Date/Time, which indicates the present moment.
Only layer elements whose reference date is between the start and end date are displayed in the map.
The following figure illustrates this filter.
The style of a layer determines the graphical representation of its spatial elements on the map. For example, the style of a line is determined by its thickness, color, dash pattern, etc. In JMap, each layer can have multiple styles. The style used depends on several factors.
Different styles can be configured for different scales. For example, a layer can have a single style for all scales while another layer can have one style for scales greater than 1:20000 and another style for scales smaller than or equal to 1:20000.
Layers also have selection styles. These styles are used to display selected elements at different scales. The selection styles are generated automatically from the layer styles but they can be customized for each layer.
The presence of thematics on a layer will override the layer styles.
When a thematic is active on a layer, the style of each element is determined by the value of its attributes and the thematic's parameters. See for more information.
As of JMap Server Jakarta, polygon layers with three-dimensional representation are supported in JMap NG applications. This representation of a third dimension is called an extrusion, and it can be configured when defining the style of the layer. The section explains the details of this configuration.
You can define one or more styles for a layer.
If there are many styles, each one will be used within a certain range of scales.
By default, one style exists for each layer and it covers the full possible scale range.
The Style tab in the layer configuration interface allows you to manage the layer's styles.
To add a new style, press Add. In the style configuration interface, you must define the maximum scale from which the new style will be used. Its minimum scale will automatically be set to infinity or to the maximum scale of the next style.
To remove a style, select it from the list and press Delete.
The greater scale style cannot be deleted.
When deleting styles, the remaining styles will be adjusted to cover the full possible scale range.
Once you have configured one or more styles, you can click on Create template (located to the right of each style) to create a new style template from one of the layer's styles. The style template will automatically be linked to the layer. See for more information.
JMap Web and JMap NG users can save a map by creating a customized map.
When the JMap administrator modifies the style of a layer, the JMap Pro, JMap Web and JMap NG users working with contexts may not be able to view the style changes made by the JMap administrator. To force the update of the layer style in the contexts, click on Force update... (located to the right of each style). By doing so, the style changes will be reflected in all the contexts of JMap Pro applications and in all the customized JMap Web and JMap NG maps that contain the layer.
You have the option to use an existing style template or to configure your own style. If you want to use a style template, click on Use a style template. You will then choose to refer to it or to copy it.
If no style template is used, you need to configure the parameters that will define the style. Start selecting Default style.
Style configuration interfaces are different depending on the type of element (points, lines, polygons, text, etc.). Some style parameters are common to many element types but others are specific to certain types.
Antialiasing is a method of representing perfect, continuous vectors on imperfect, discontinuous display devices so that they look as perfect as possible. In every style configuration section in JMap Admin, antialiasing is enabled by default, which improves the appearance of your maps. However, display performances are reduced when antialiasing is enabled, so use it judiciously.
The following figure shows an example of a polygon border with antialiasing (left) and without antialiasing (right).
Partial object transparency can be used for every type of map element. A map element with a transparency value of 0% will be completely opaque while one with a 100% value will be invisible.
The following figure shows an example of a polygon with a transparency value of 50% (left) and one with a transparency value of 10% (right).
There is a selection style for each style of the layer. The selection styles are used to represent the elements when they are selected on the map. By default, the selection styles are generated automatically using the layer's basic styles and the project's default selection color.
To modify the selection style, unselect the Generate from default style option and adjust the style parameters as needed.
The style of polygonal layers allows you to configure a three-dimensional representation of the polygons.
In the configuration interface for the layer's style parameters, under the Extrusion section, check Enabled to enable extrusion in JMap NG applications. This function is disabled by default.
Click on Configure to open the extrusion configuration window.
Click on Delete to delete the extrusion configuration.
In addition to configuring the style of a layer, you can also create graphical representations to analyze the distribution of point data.
Clustering, as its name implies, creates clusters of points on the screen. Special symbols are used to graphically represent these clusters on the map and display the number of elements they contain.
Heat maps are used to graphically represent the concentration distributions of a type of object or event on the territory. The more the color of a zone is intense, the more the concentration is high.
Determines if the layer is published or not. See for more information.
General information configured when creating the layer. This button provides direct access to the section settings configuration interface.
Bound attributes This section presents a list of attributes related to the layer. Click on the to open the configuration window of its properties. This button is used to update the statistics of the attributes.
Cache Information about the layer's Mapbox cache. Indicates whether the cache is enabled, whether a due date is set, the number of cached tiles, and usage metrics. Press to update the cache or press to delete it.
JMap Cloud This section allows the layer to be shared in JMap Cloud platform. Section provides details on this function.
This section presents the layer's thematics. Click on the name of the thematic to access its configuration interface.
This section presents information on the labels.
This section describes the mouseover configured for the layer.
This section presents the reports configured for the layer.
This section presents information about forms configured for the layer. Click on the form name to access its configuration interface.
These buttons allow you to edit the layer configuration or delete it as well as to access the .
Tabs provide access to the sections , , , , , , , and . The which require the configuration of parameters at the layer level add tabs.
You can change the title of the attribute. This icon allows you to provide the title in multiple languages.
Specify a format pattern for displaying SDS items. The pattern must follow Java standards. For more details on this topic, read the following article: .
JMap Pro users can change the style of layers and save their changes by creating . These contexts can be shared with other users and made public to all users who access the application.
Transparency
Specify the partial transparency of the line.
Arrow type
Specify the arrow option to use: None: No arrow. Forward: Place an arrow on the line pointing toward the last point of the line. Backward: Place an arrow on the line pointing toward the first point of the line.
Arrow position
If an arrow is used, determines the relative position of the arrow. A value of 50% places the arrow in the center of the line.
Line thickness
Specify the thickness of the line, in pixels.
Line color
Specify the color of the line.
Stroke style
Specify the stroke style (dashed, solid, with border, etc.) to use to draw the line. JMap provides many stroke styles.
Border thickness
If the line has a border, specify its thickness.
Border color
If a line stroke with a border is used, specify the color of the border.
Use antialiasing
Select this option to enable antialiasing.
Transparency
Specify the partial transparency of the polygon.
Transparent fill
Select this option to have the inside of the polygon completely transparent.
Fill color
Specify the color of the interior of the polygon.
Stroke style
Specify the stroke style (dashed, solid, with border, etc.) to use to draw the border of the polygon. JMap provides many stroke styles.
Border thickness
Specify the thickness of the borders of the polygon.
Border color
Specify the color of the border of the polygon.
Pattern
Specify the fill pattern to use. JMap provides many patterns.
Pattern color
If a pattern is used, specify the color of the pattern.
Transparent pattern fill
If a fill pattern is used, select this option to make the pattern background completely transparent.
Use antialiasing
Select this option to enable antialiasing.
Transparency
Specify the partial transparency of the text.
Font
Specify the font used to display the annotation text.
Bold
Select this option to use bold text.
Italic
Select this option to use italic text.
Underlined
Select this option to use underlined text.
Striked through
Select this option to use strikethrough text.
Outlined
Select this option to use outlined text. Outlined text has an outline that may be of a different color. This helps make the text on the map more readable.
Outline color
If outlined text is used, specify the color of the outline.
Text color
Specify the color of the text.
Transparency
Specify the partial transparency of the image.
Base
Select the numeric attribute that indicates the height of the terrain on which the polygon is found.
Height
Select the numeric attribute that indicates the height of the polygon.
Transparency
Specify the partial transparency of the extruded polygons.
Distance
Minimum distance (in pixels) between 2 points in order for them to form a cluster.
Minimum elements
The minimum number of elements required to create a cluster.
Symbol
Symbol used to represent a cluster on the map.
Label
The settings of the label (font, color, etc.) that will display the number of elements in a cluster.
Radius
The radius used to display the density map around each point.
Weight
Numeric attribute that determines the weight of each point to display the density map. The more the weight is high, the more the color is intense. This parameter is optional.
Opacity
Determines the degree of opacity for the display of the density map.
Intensity
Defines the intensity of the colors based on the concentration of points. If the intensity is lower, more points will be needed to produce intense colors.
Display points
Allows you to display the points of the layer under the density map. The points will be hidden by the density map if the opacity is very high.
Symbol
Select the symbol that will be used to represent the elements. The symbol can be a vector symbol or an image.
Vector symbols are provided with JMap and offer special features. They can be resized without distortion and their border and fill color can be modified. However, they cannot be customized easily.
JMap offers image libraries, which include SVG images. These image libraries are accessed under the Images tab. You can also provide your own image libraries. Their quality will be decreased if they are resized, unless you use SVG images.
Size
Specify the size of the symbol. A value of 1 corresponds to the original size of the symbol or image.
Proportional size
Select this option if you want the size of the displayed symbols to vary in proportion with the map scale. You must enter the reference scale that will display the normal size of the symbols.
Use antialiasing
Select this option to activate antialiasing.
Transparency
Specify the partial transparency of the symbol.
Offset (x,y)
Adjust the original point of the symbol by offsetting the symbol by X and Y according to the specified values. The original point corresponds to the exact coordinates of the point element.
Rotate symbol with the map
Select this option to have the symbol rotated when the map is rotated. If this option is not selected, the symbol will always have its default angle, regardless of the map rotation.
Rotation
Specify the rotation to apply to the symbol.
Border thickness
(For vector symbols only) Specify the border thickness of the vector symbol.
Border color
(For vector symbols only) Specify the color of the lines of the vector symbol.
Transparent fill
(For vector symbols only) Select this option to have the inside of the vector symbol completely transparent.
Fill color
(For vector symbols only) Specify the color of the interior of the vector symbol.
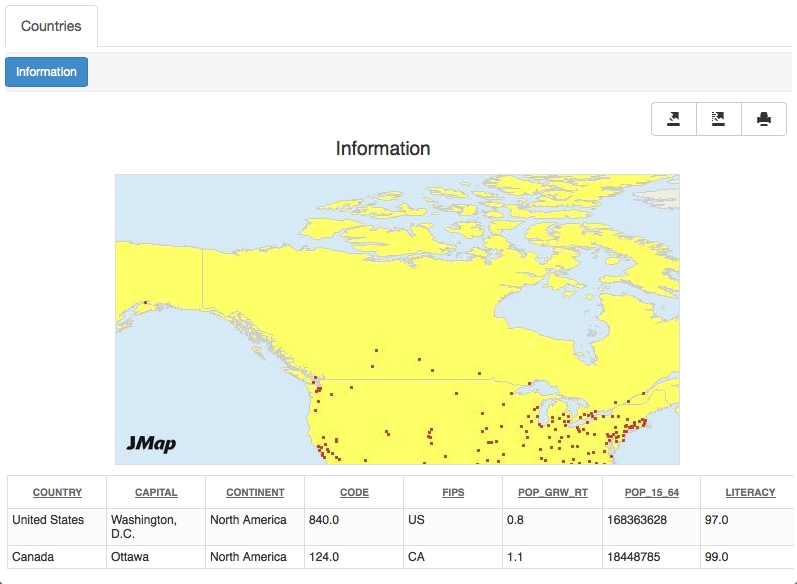
Information reports are used to display descriptive information regarding map elements. These reports can display attributes extracted from the underlying spatial data source or information from databases outside JMap. Each layer can have zero, one or more reports. The information reports are presented as web pages or PDF documents.
The Reports tab of the layer configuration interface provides the tools to configure reports.
The tab shows the list of existing reports for a layer. In JMap applications, reports are presented in this order. You can change the order using the Modify menu.
To create a new information report, press Create.
To delete a report, press Delete.
There are three different types of reports: Basic, Advanced and Custom.
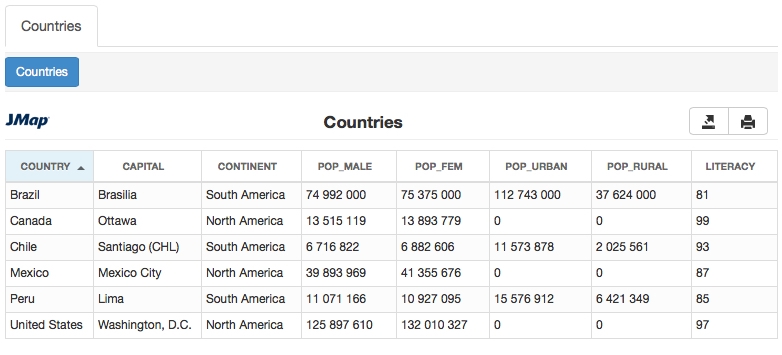
Basic reports are generated as web pages. They contain features to be printed and exported in Excel. Tables containing the values can be sorted by clicking on the column headers. You can also configure the names of the fields to be displayed in the reports.
Configuration
Title
The title of the report.
Extract data from
Template (single)
Template used for reports on a single map element.
Template (multiple)
Template used for reports on multiple map elements.
Attributes
Title
Text to be displayed in the report instead of the attribute name.
Advanced reports are based on the BIRT reporting tool (http://www.eclipse.org/birt/). A default report template is provided with JMap. You can also use the BIRT report Designer application to create custom reports or to edit the template provided in order to adapt it to your needs (add a logo, change the colors, etc.). For more information on report development, visit the BIRT website (http://www.eclipse.org/birt).
Reports can be generated in HTML or PDF format. Geographic map integration is also supported.
Format
HTML: The report is generated as a web page. Tools allow you to export and print the report's content. If the report is created for multiple map elements, its content can be sorted by clicking on the column headers. PDF: The report is generated in PDF format. This format is better suited for printing because the page layout is better. However, the content of this type of report is more static compared to the HTML report.
Title
The title of the report.
Extract data from
Template (single)
Template (multiple)
With advanced reports, you can choose the report template you wish to use.
By default, two templates are provided with JMap: a basic report template and a report template with an integrated geographic map. Each one of these templates is also available in two versions: one version is for a single element and the other is for a selection of multiple elements.
You can create your own report templates based on the existing templates and add them to those provided by JMap. You can then select your templates to configure reports.
The report template files (.rpttemplate) are placed in the JMAP_HOME/applications/templates/reports directory.
Your templates must be placed in the single or multiple sub-directory, depending on whether they are in single element or multiple element version.
Custom reports are external to JMap and can be called using a URL. These reports can come from reporting tools (e.g. Crystal Reports, Jaspersoft, etc.) or from simple web pages.
A special syntax allows you to format the parameters to be passed in order to open the report.
Title
The title of the report.
Report URL
Enter the URL that will allow you to open the external report. You will probably have to pass certain parameters in the report URL to identify the elements for which you wish to open a report. The parameter values usually come from the bound attributes of map elements. A special syntax is used to format the parameters.
%n
Replaced by the corresponding bound attribute value for the element. For example, %0 refers to the 1st bound attribute, %1, to the second one, etc.
%f
%p
Replaced by the currently opened project name.
%u
Replaced by the name of the user currently logged in.
%s
Replaced by the current session id.
%h
Replaced by the host name or address of the JMap Server instance the client is connected to.
%o
Replaced by the port number (http or direct) of the JMap Server instance the client is connected to.
%t
Replaced by the current time (date and time).
Basic and advanced reports can take their data from layer attributes or from an external database connected to JMap.
Select the Current layer option to create a simple report that will only query the layer attributes (read below for the External database option). Afterwards, select the attributes to include in the report using the check boxes. Only the selected attributes will be displayed to the user; the others will be excluded from the report. Lastly, you can specify titles for the attributes; these will be displayed to the user instead of the actual attribute names.
Selecting the External database option will instruct JMap to display information taken from another database, instead of the layer. This option allows you to query any database that has a field corresponding to one of the layer's attributes.
Attributes
Database
Select the database from which the report data will be extracted. The database to query must have been configured in JMap Admin beforehand.
SQL query
Enter the SELECT SQL query that will be used to extract the data from the database. This query can have several tables. The query must include the key field used to join with a layer attribute.Afterwards, you must click on Execute in order to execute the query once.
Join fields
Table
Select the table containing the join field.
Field
Among the fields in the selected table, select the field that will be used to join with the layer.
Attributes
Select the layer attribute that will be used to join with the data from the database.
For reports that take their data from an external database, you can define the names of the fields to be displayed in the report, instead of using the field names in the database. Click on Captions to define these field names.
In JMap, labels are text that is related to map elements. They are used to display information about the elements on the map. For example, you can use labels to display the city names for a layer of points representing cities.
Labels can either be placed manually using the labeling tool or generated automatically by JMap at display time. Depending on the type of elements of the layer, the labeling configuration section can slightly vary.
The following figure shows an example of curved labels (left) and labels with a frame (right).
The following figure shows an example of of labels with a background symbol.
Labeling is configured by specifying text that defines the label's content; this text can contain static parts, variable parts (functions) and JavaScript programs. At display time, functions are executed and replaced by the result. For example, the ElementValue(attrib) function (or ev(attrib) in its short form) will be replaced by the value of the corresponding attribute. JavaScript programs can be used to perform operations on attribute values. Label text can span multiple lines.
The functions supported by labels are the same as those supported by mouseover. For more information on these functions, refer to the Mouseover section.
Labeling parameters
Label text
The text of the label.
Static parts will be displayed as is and ev(attrib) functions will be replaced by the corresponding bound attribute values.
Unlike mouseover bubbles, labels don't support HTML formatting or hyperlinks.
See the following examples:
Country: ev(country) Country: Canada
City: ev(city) (ev(country)) City: Paris (France)
Population: ev(pop) Population: 2150000
Labels also support JavaScript programming to perform mathematical operations as well as operations on character strings using attribute values. The print function is used to print content in the label.
Area: ev(area_km2) km2
<script>
var SQ_KM_IN_SQ_MI = 2.58998811;
var area_sq_mi = ev(area_km2) / SQ_KM_IN_SQ_MI;
print(area_sq_mi.toFixed(1) + " sq. mi");
</script>
leads to:
Area:
91935.7 km2
31635.6 sq. mi
Label style
Font
Select the font to use to display the labels.
Size
Select the size of the font.
Bold, Italic, Underline, Striked through
Select the font attributes.
Outlined
Select this option to display an outline around the label text. This makes it easier to read labels on the map.
Use antialiasing
Select this option to enable antialiasing.
Text color
Select the color of the label text.
Outline color
If the Outlined option is selected, choose the color of the outline. White is the default.
Automatic labeling adds labels to map elements automatically, without user interaction. For each vector layer, you can enable or disable automatic labeling and define scales between which automatic labeling will be activated. It is often useful to set a minimum scale limit for automatic labeling to avoid overcrowding the map.
Also, in order to avoid overcrowding the map, three tools allow you to control the order or priority in the position or display of the labels: dynamic position, layer priority, and priority by attribute.
Automatic labeling
Select this option to enable automatic labeling.
Minimum scale
Minimum scale over which automatic labeling will be activated.
Maximum scale
Maximum scale under which automatic labeling will be activated.
Label position
The position of the label in relation to the map element is determined based on a grid, with nine possible positions. This position can be fixed or dynamic. Fixed: The label is always displayed at the selected position. This is the default option. Dynamic: The position of the labels of the layer varies according to the relative priority established for each position of the grid. This function allows you to display the maximum number of labels avoiding overlapping conflicts of labels. Possible values are: 0 Blocked, 1 High, 2 Medium, and 3 Low. The default value of the center position is 1. At first JMap attempts to place the label in the center position. If this position is occupied by another label, JMap places the label in another lower priority position (Medium or Low) to minimize conflicts. Once you have defined the relative priorities in the grid, you must check the Dynamic placement box to activate the function.
Label offset
Enter an offset in X and Y to modify the position of the label text.
Layer priority
This parameter allows you to assign the layer a priority over other layers for displaying its labels. This priority is relative, depending on the other layers that are present. The available values, from lowest to highest priority, are the following: Normal, Above Normal, High, Very High, Maximum. For example, the labels of a layer with a High priority are displayed before the labels of a layer whose priority is lower (Normal or Above Normal).
Priority by attribute
This parameter allows you to assign a display priority to the elements of a layer based on the value of an attribute. This priority is relative and depends on the other elements that are present in the same layer. For example, in a road network layer in which road sections are categorized according to their importance, the labels of the most important sections have a higher display priority than the labels of the less important sections. The attribute can be numeric or alphanumeric, and it must be possible to organize the values in ascending or descending order. Check this option to select the attribute to use for the prioritization in the drop-down menu. This icon is used to establish whether the priority gradient is in the ascending or descending direction of the values.
Allow labels overlapping
Allow the labels of one layer to overlap and to overlap the labels of other layers. This option overrides the global project setting that prevents label overlapping. This can be useful to ensure that all labels of this layer are displayed.
Prevent label duplication
Select this option to avoid having the same label text displayed many times. Useful for displaying street names.
Parse numeric labels
If label contains text and numbers, display only numeric values. Useful when you want to display only highway numbers using an attribute containing other text (e.g. "Highway 40" becomes "40").
Oriented labels (along the line)
Only for line elements. Select this option to display the label text along the lines.
Curved labels
Only for line elements. Select this option to have the label text follow curved lines.
Proportional size
By default, label text is always displayed at the specified font size, independently of the scale of the map. Use this option to have the label text size adjusted proportionally to the scale of the map. The text will be displayed at its specified font size when looking at the map at the specified reference scale. When the scale of the displayed map is changed, the text size will be modified accordingly.
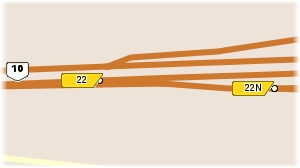
Background symbol
Select this option in order to choose a symbol that will be displayed behind the label text. Note that the label text should fit in the selected symbol. This is used mainly for highway shields containing highway numbers.
Draw frame
Select this option to draw a frame around the label text. You can also select the color of the background of the frame as well as the color of its border.
Rotation
Select this option if you want the labels to have a rotation. Angle attribute: You can select a numeric bound attribute that contains the rotation angle of the text. The labels will follow this rotation. Rotation direction: If an angle attribute is used, select the direction of the rotation.
Follow map rotation
Select this option to have the labels rotated with the map if the user sets a map rotation.
Follow symbol position
Check this option if you want the labels to follow the symbol when an offset is applied to it.
Dynamic placement
Select this option to enable dynamic placement of the labels. This option allows you to enable or disable the dynamic placement settings you configured in the Label position section.
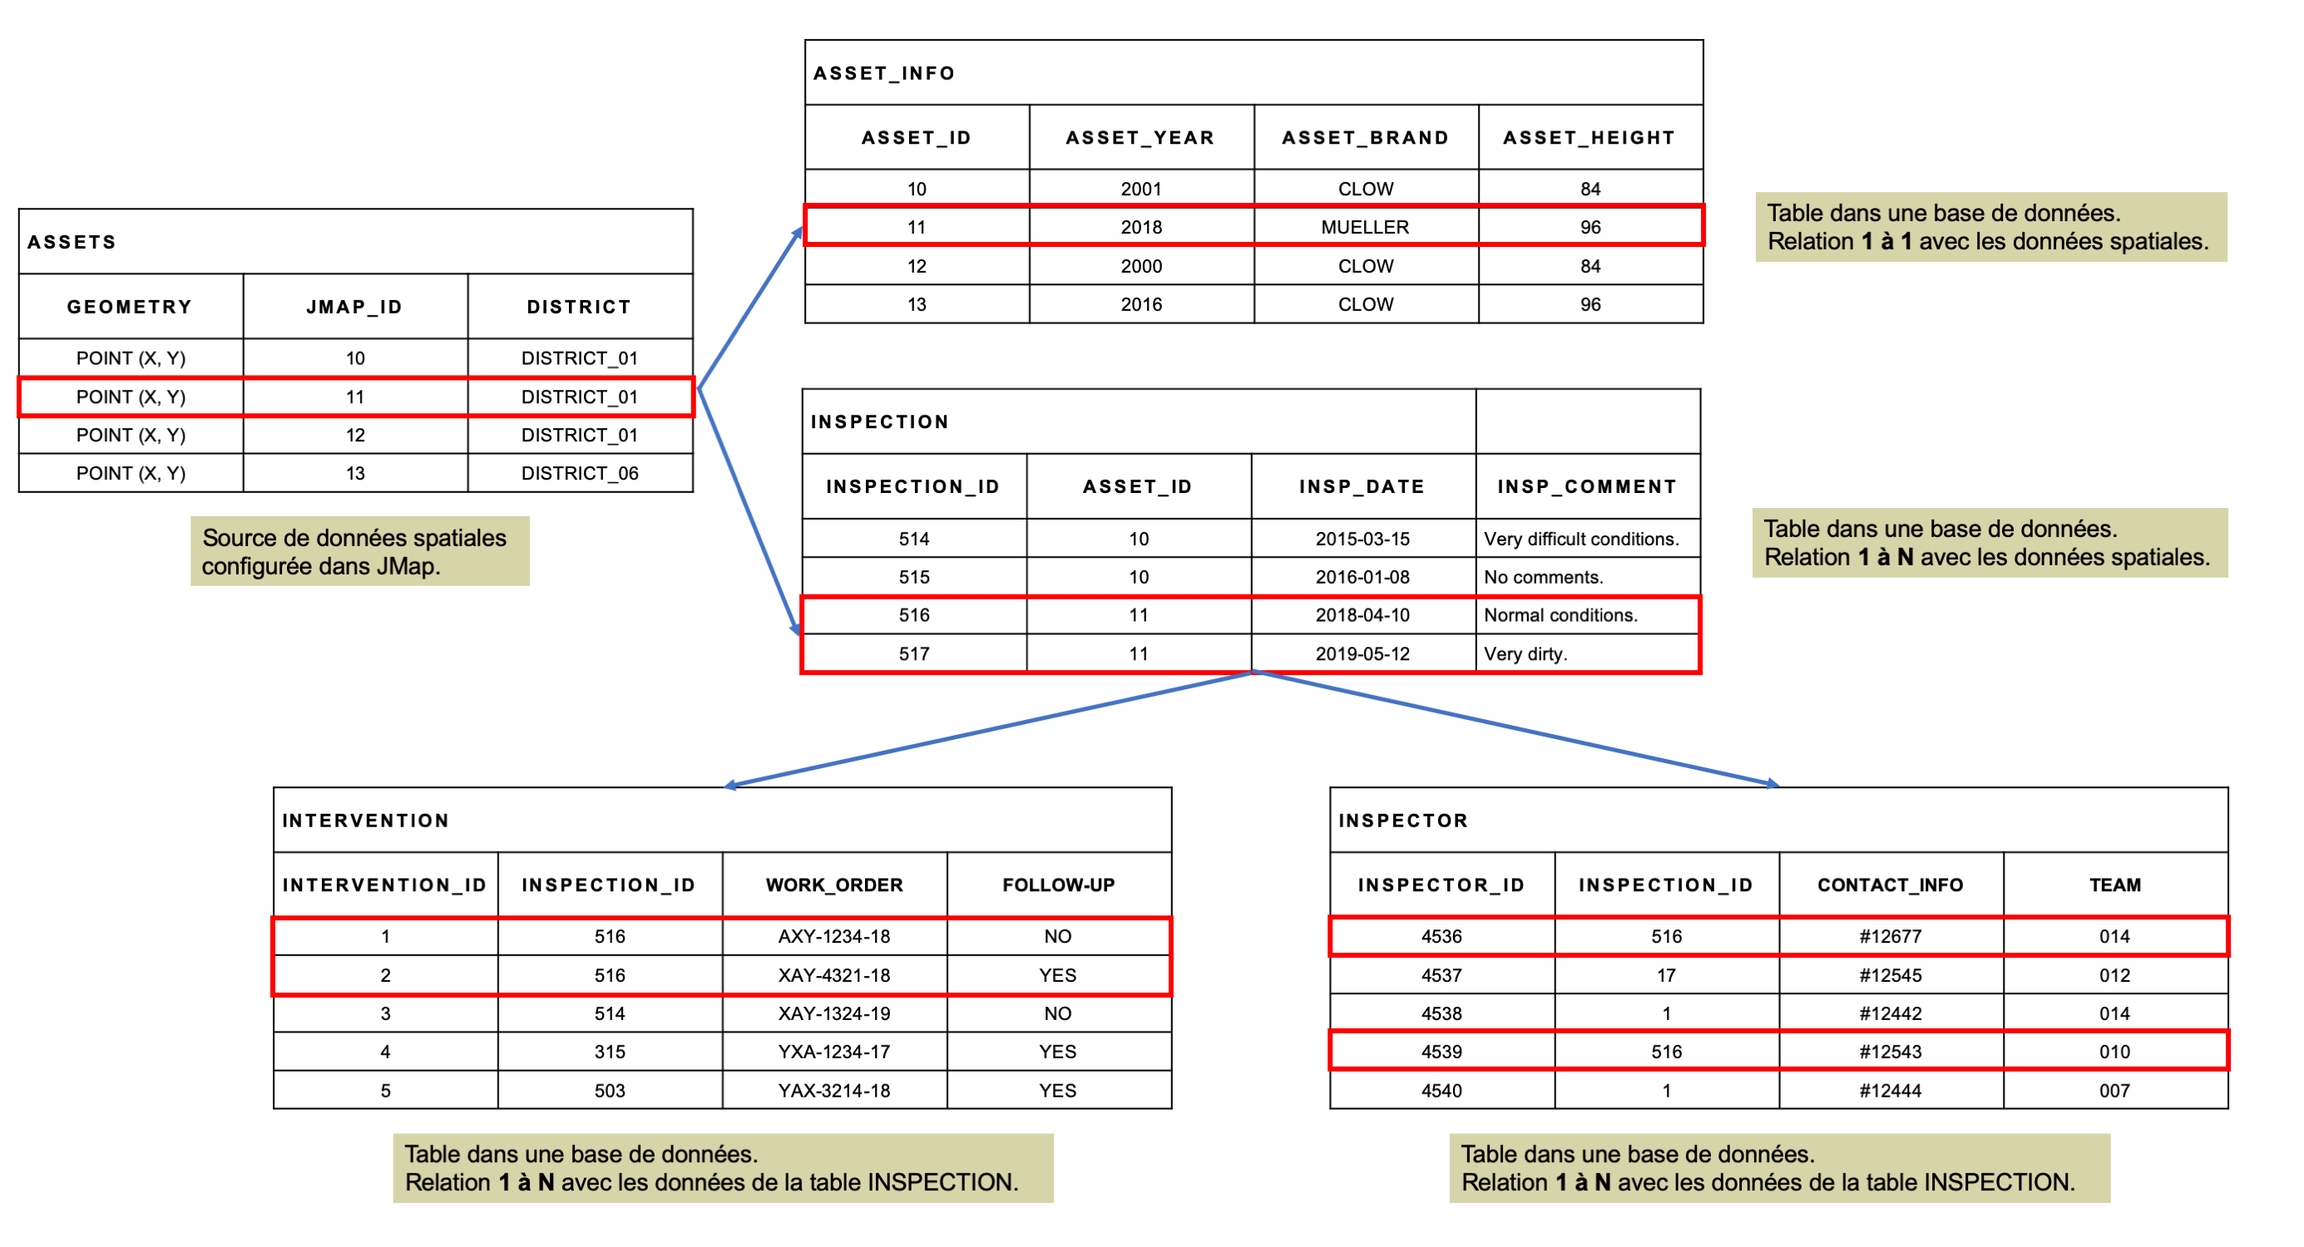
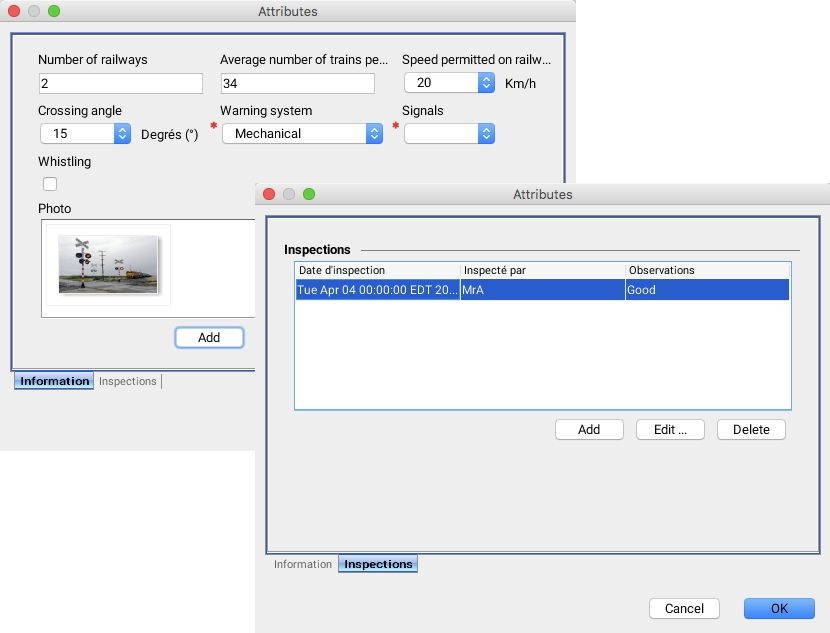
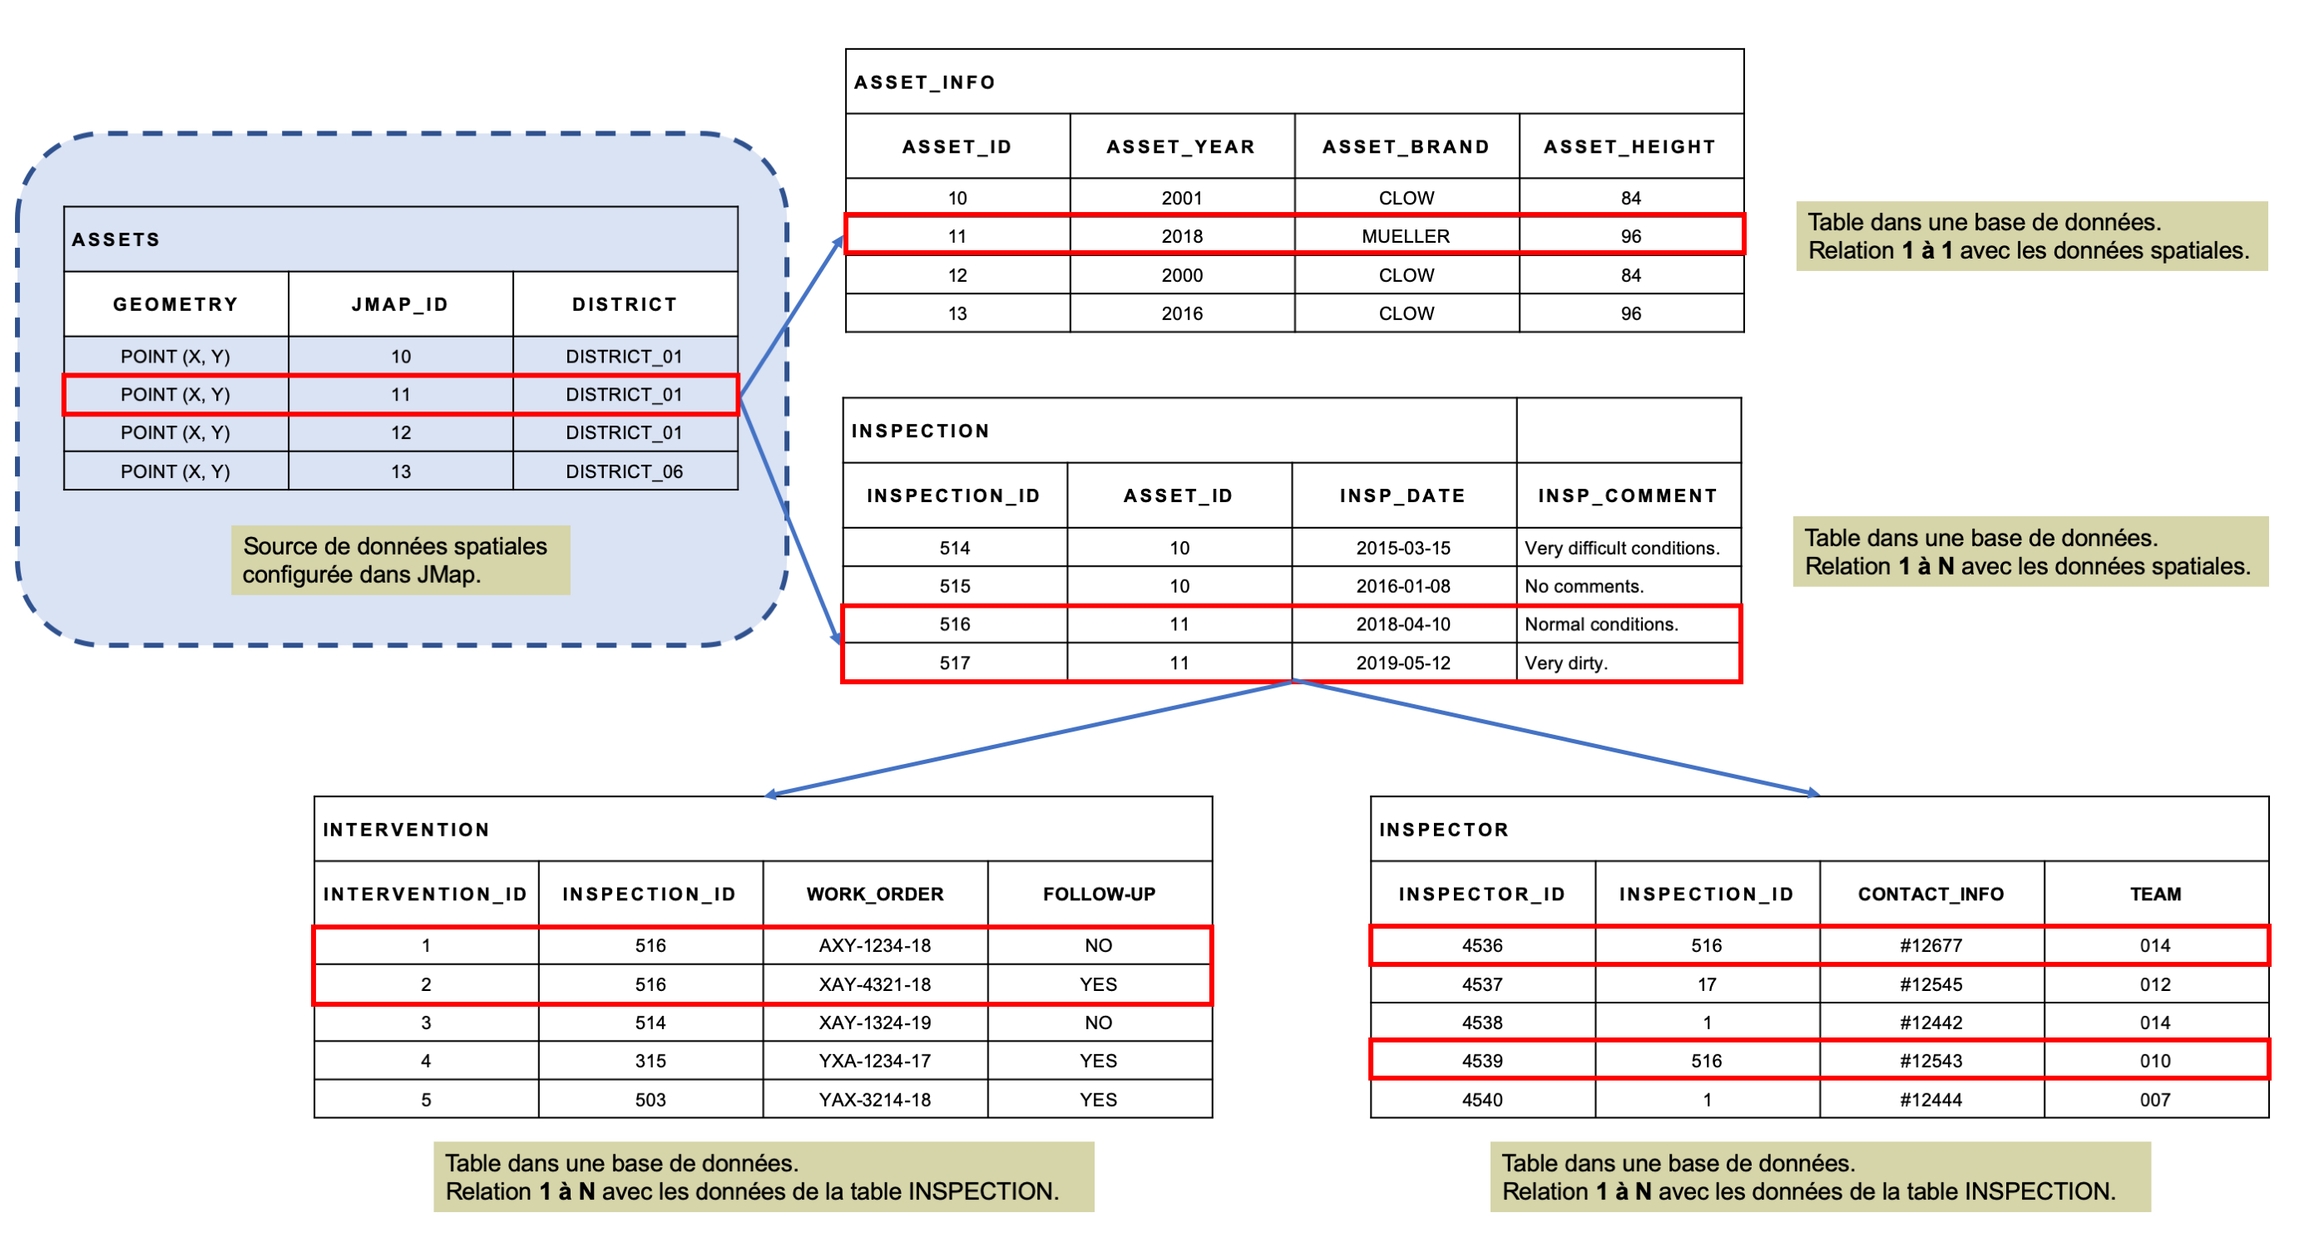
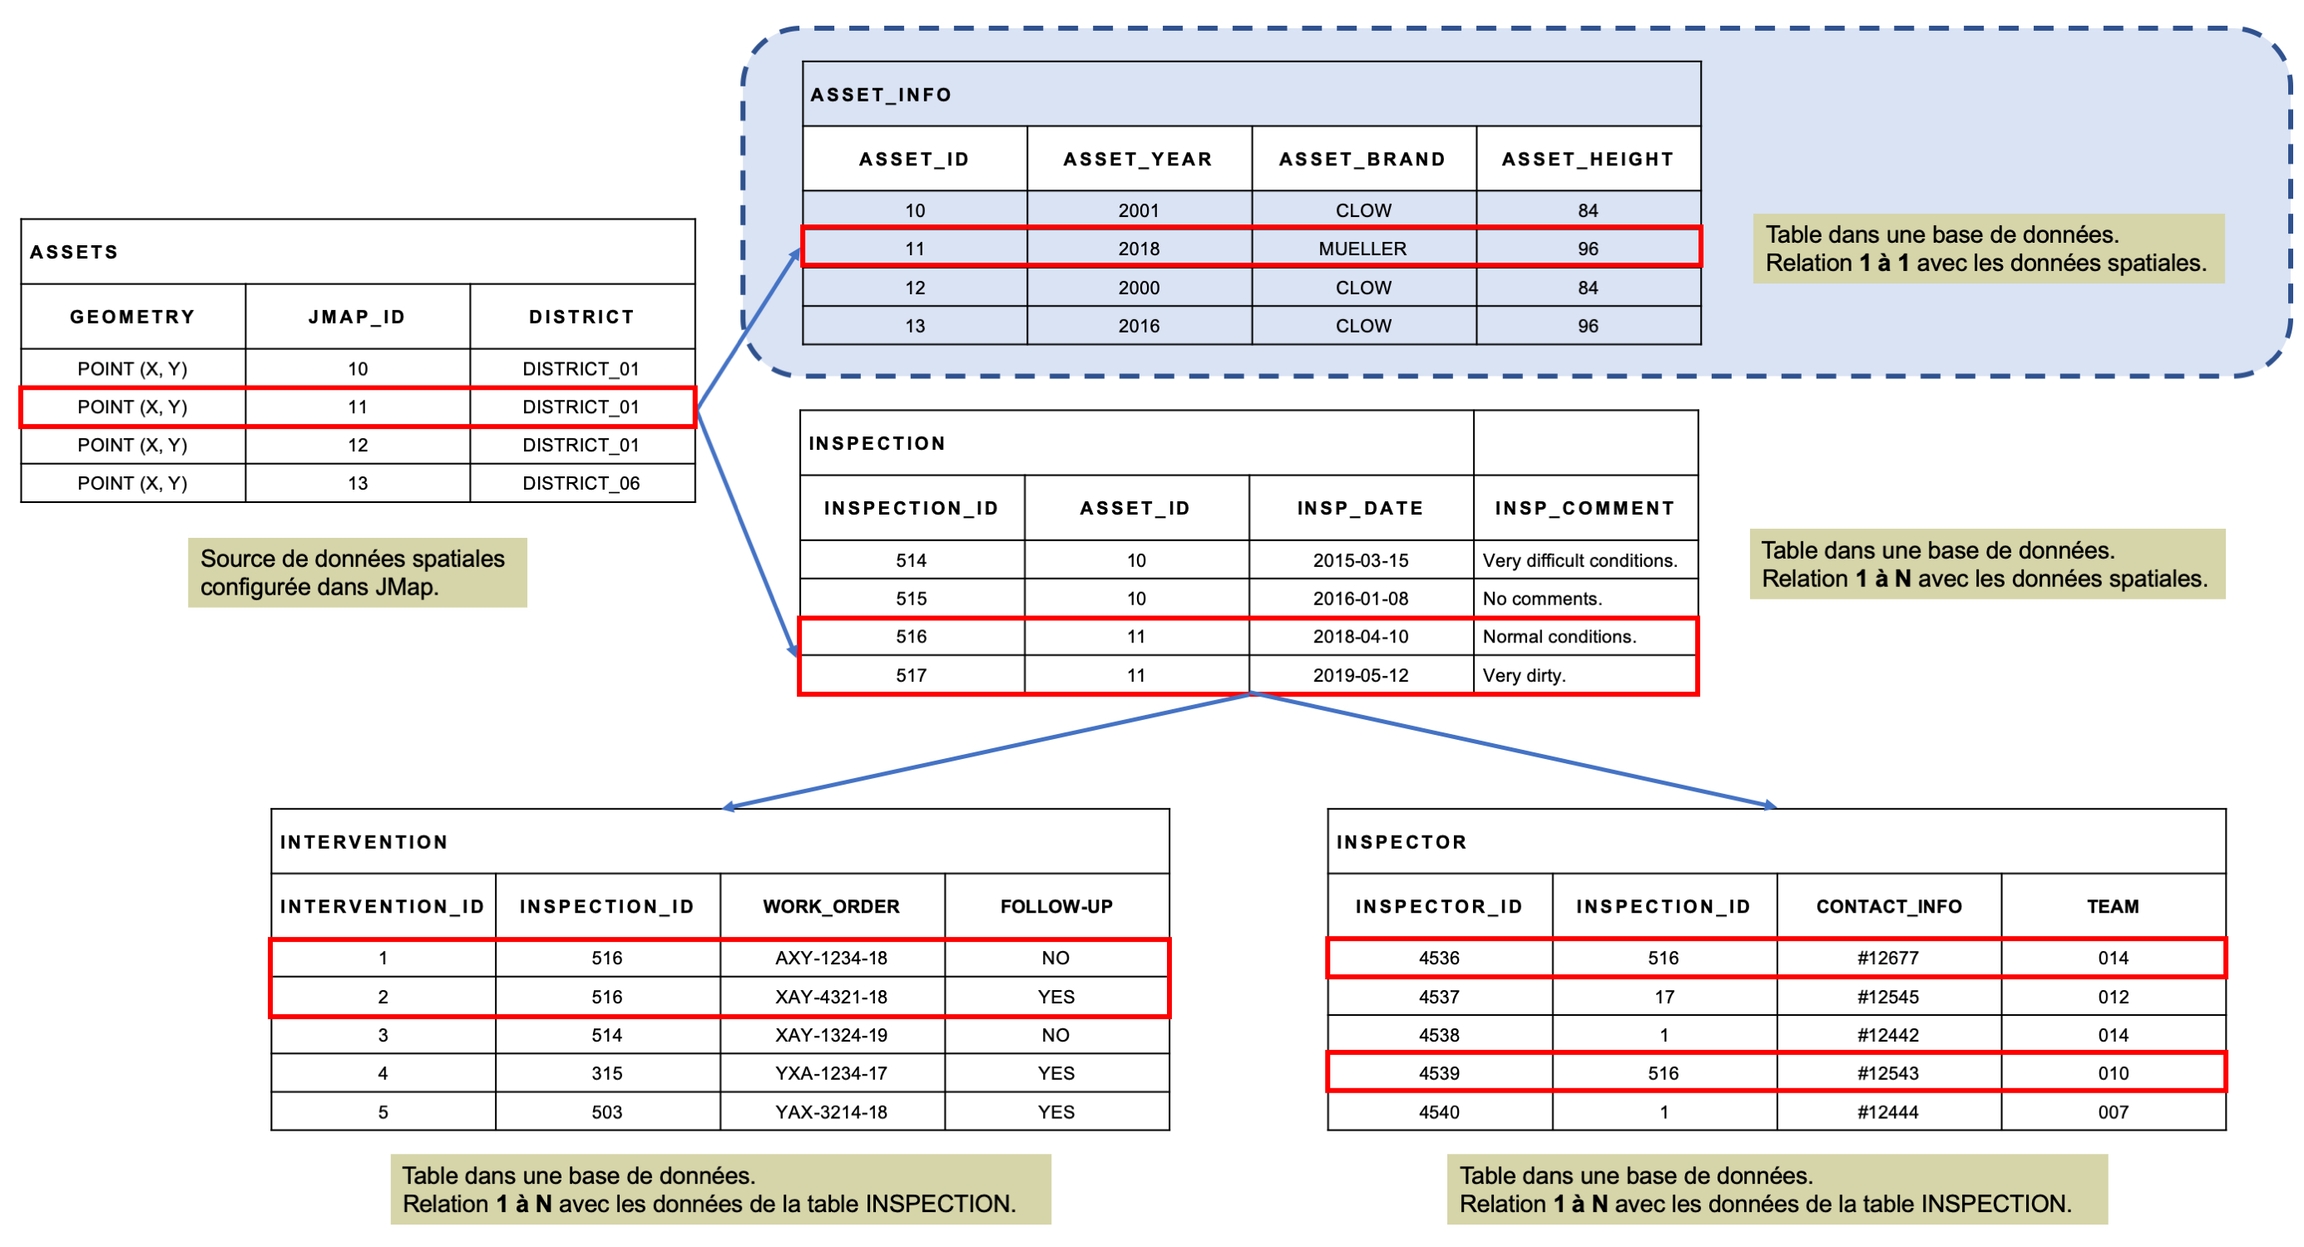
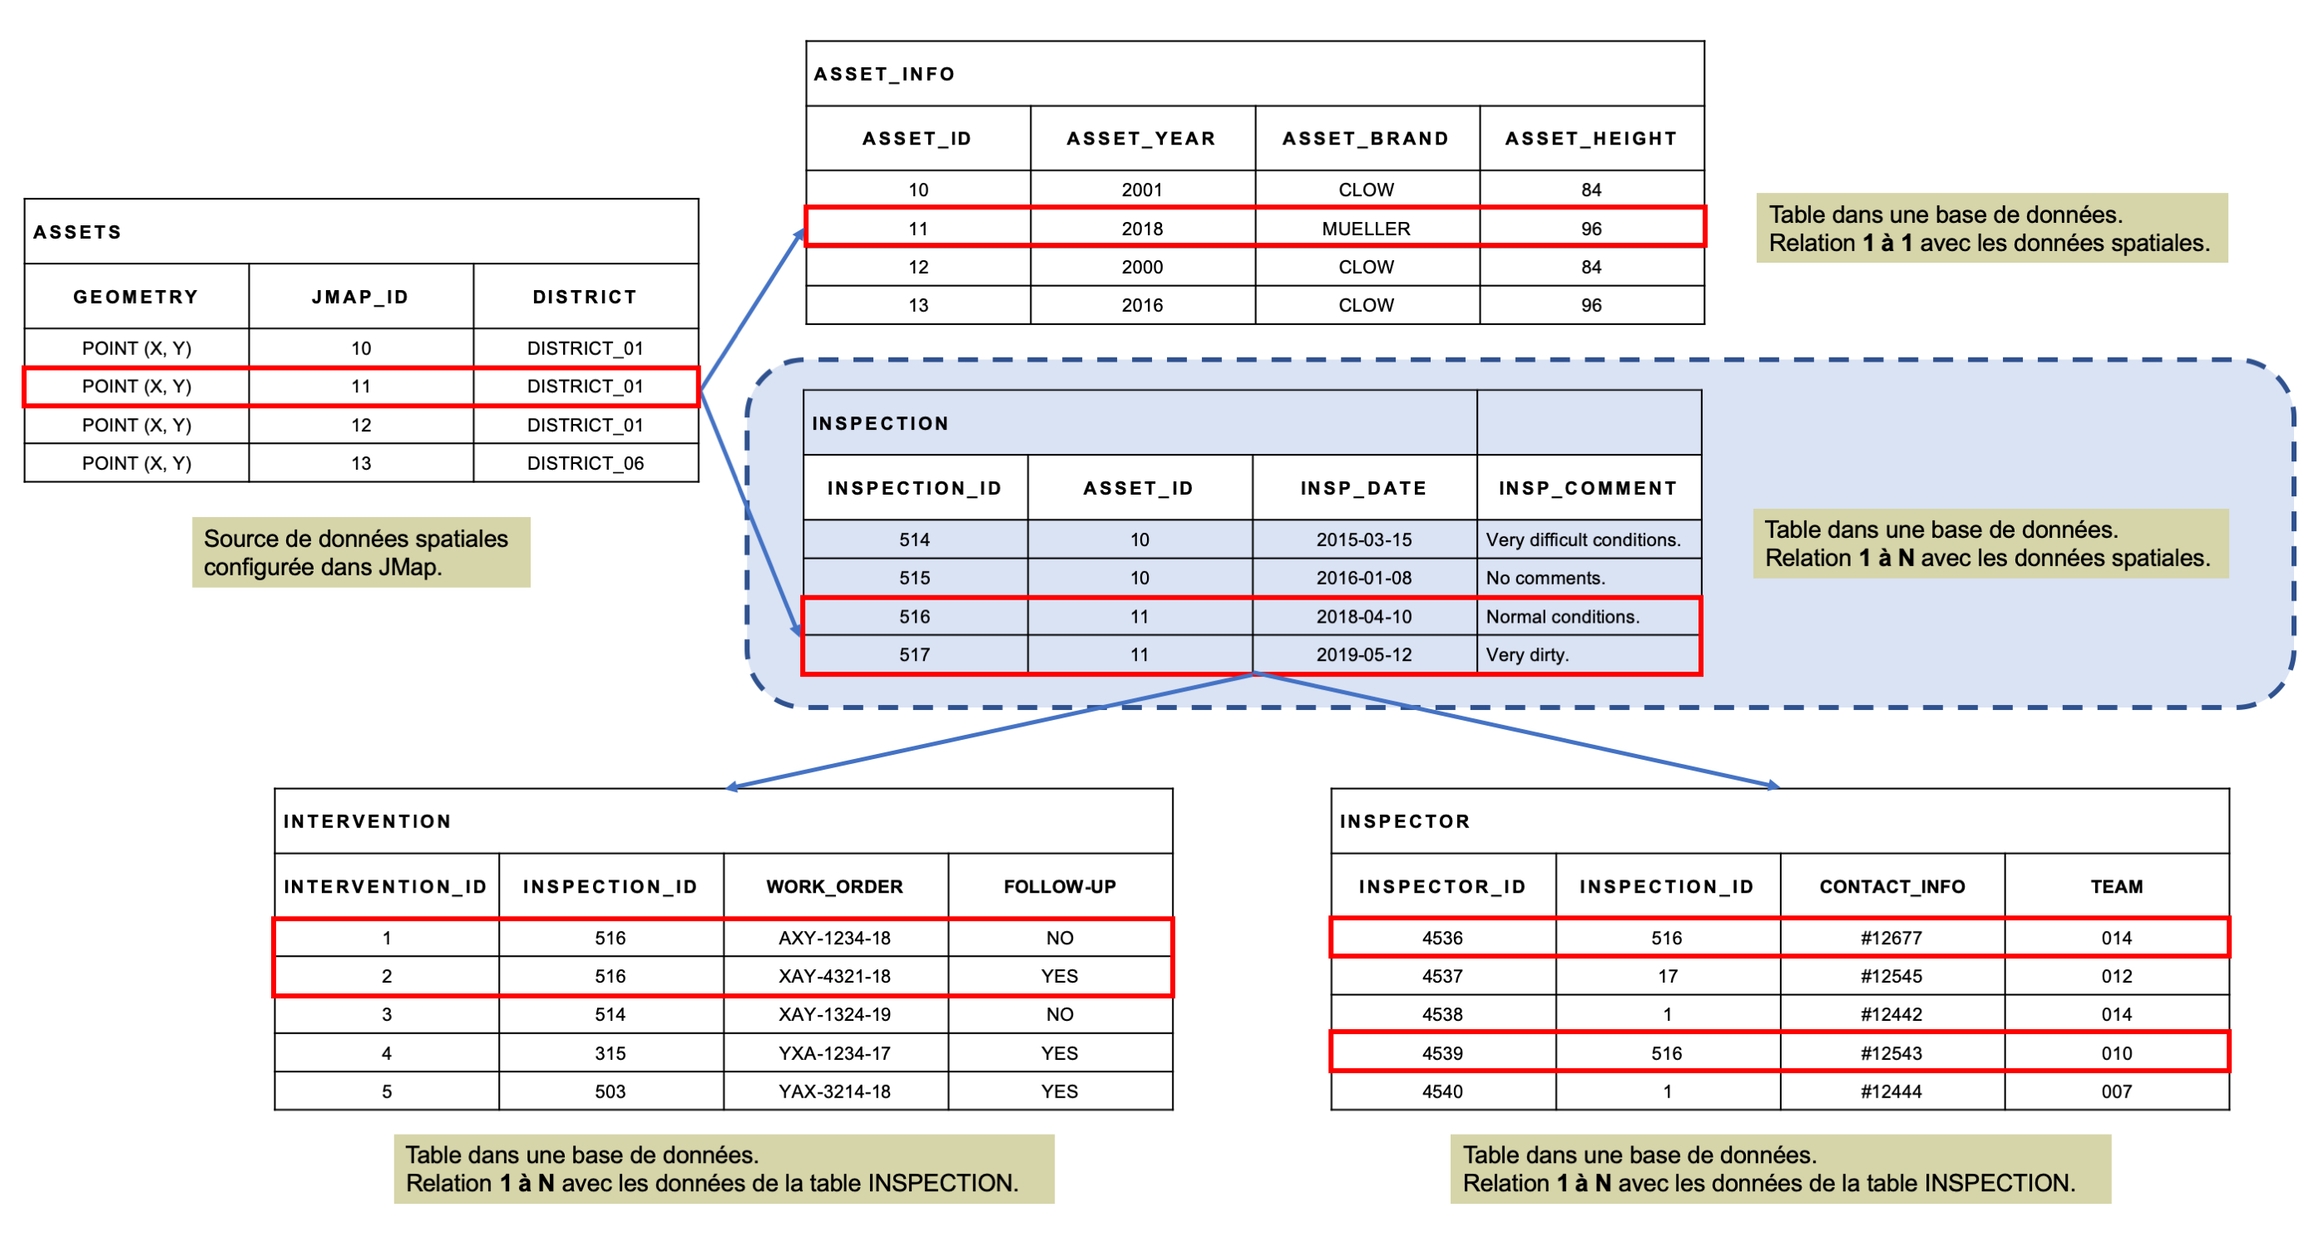
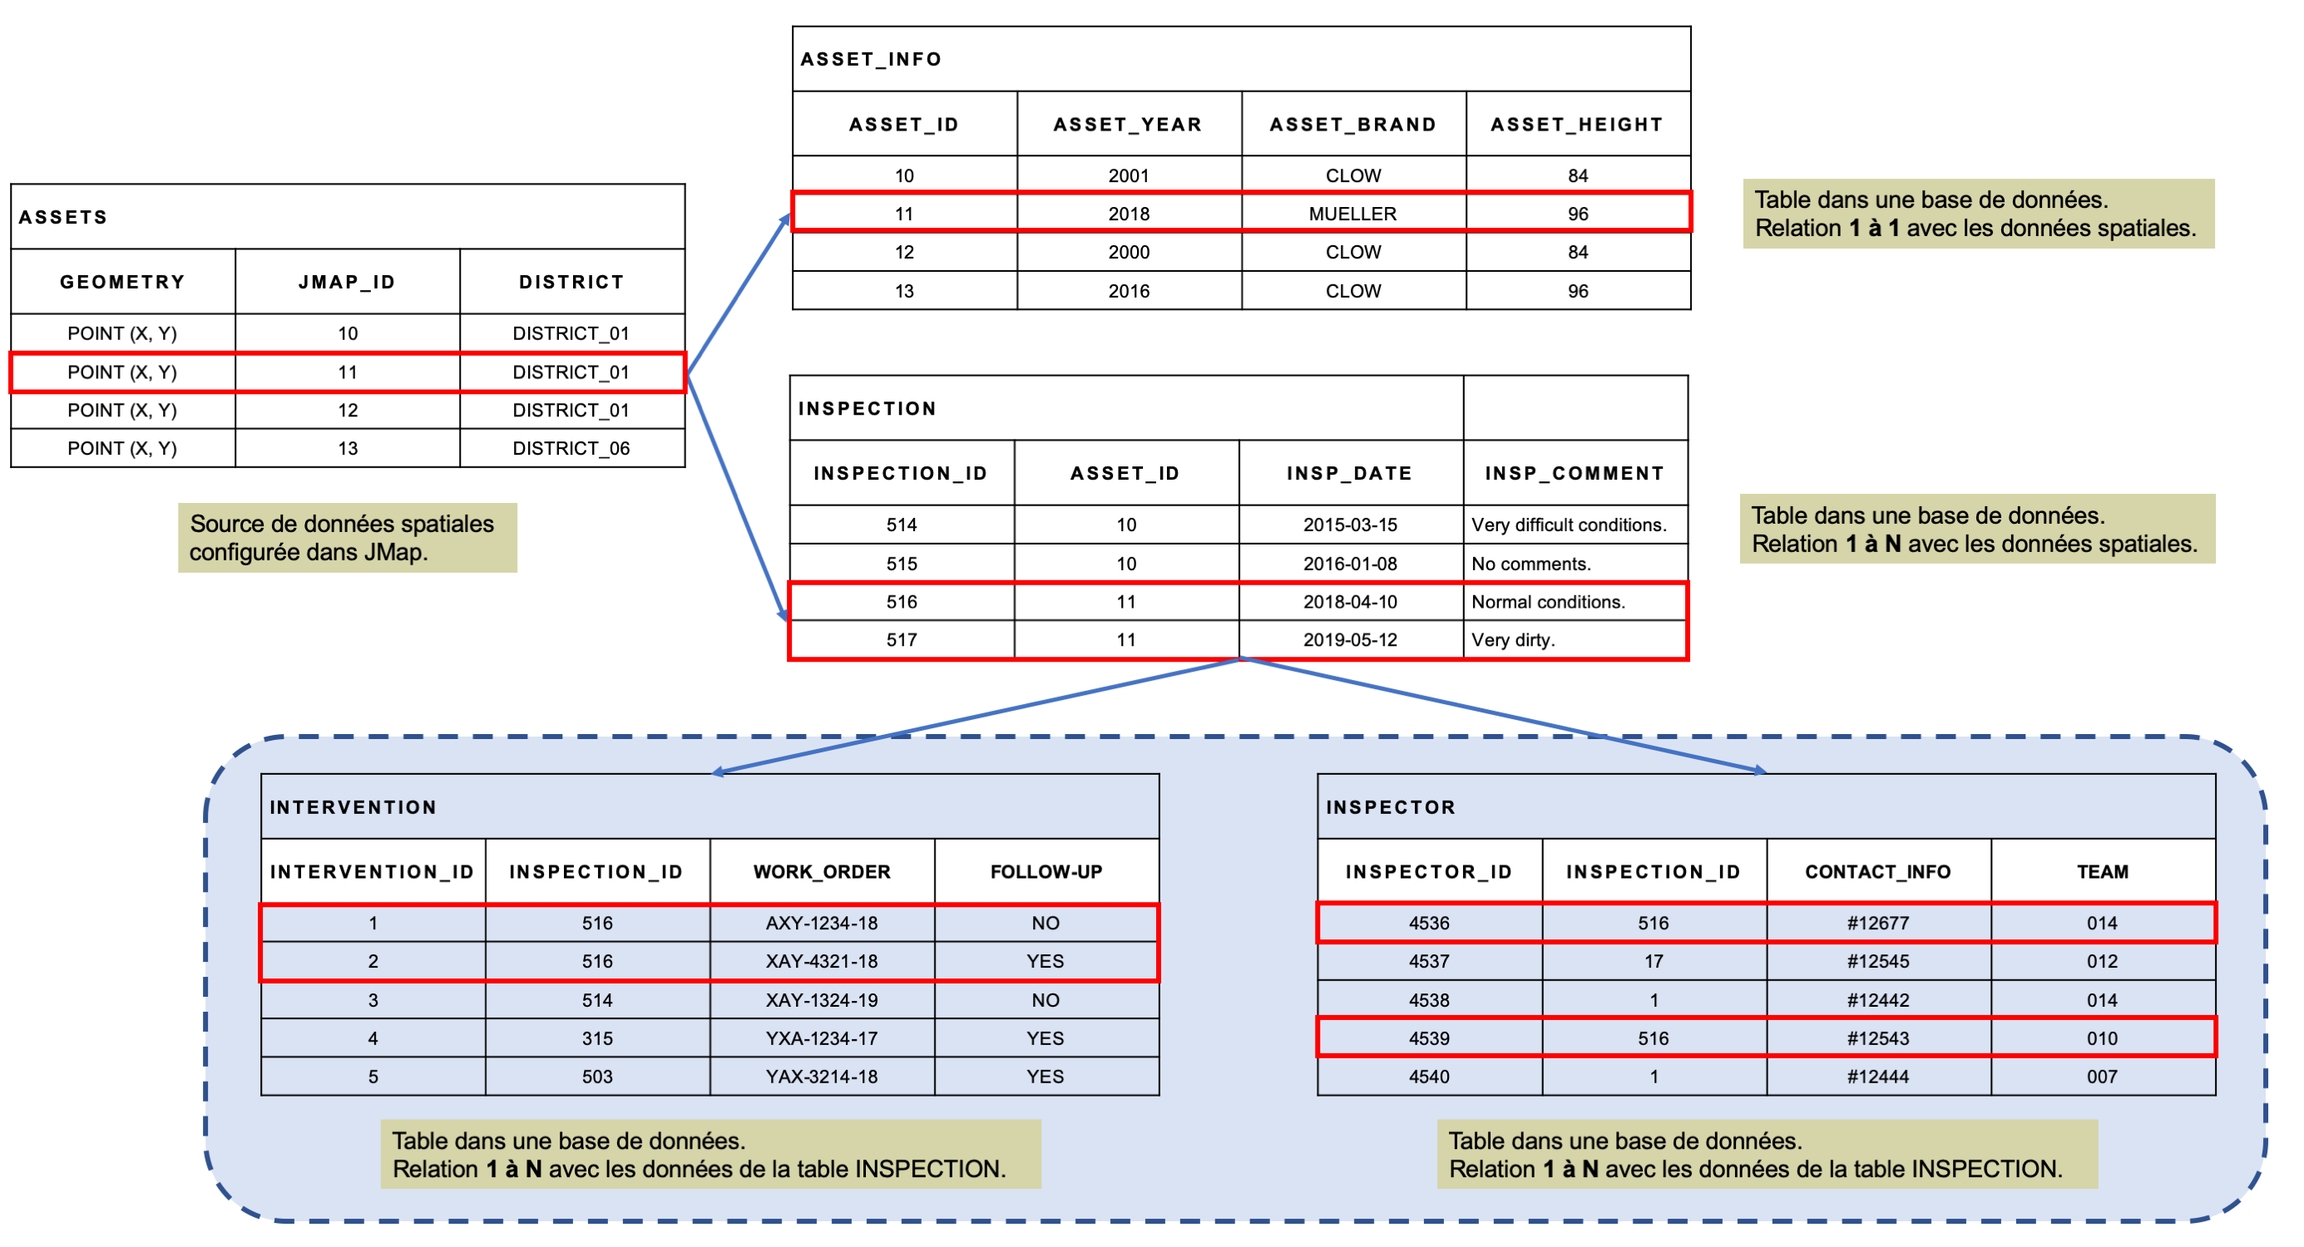
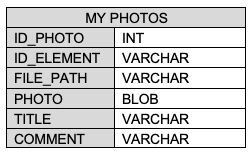
The sections Layer Attributes Forms, Database Forms and Attribute Query Forms describe the steps to create forms and subforms. The examples mentioned refer to the tables in the following figure:
In JMap, forms are used for attribute queries to enter the search parameters, to enter attribute values of editable layers and to manage data stored in databases. This is always done in relation with the elements of a layer. A type of form called a subform can also be accessed from another form.
The JMap administrator designs the forms using the form designer. Afterwards, users can use them in JMap Pro, JMap NG and JMap Survey. Depending on access permissions, users can use data entry forms to view, add, modify or delete data.
To enter the attributes of a layer’s elements, JMap generates a default form if none has been created. This simple form shows all available attributes. In general, it is much more convenient to create a form adapted to your needs.
The following sections explain the form creation process in detail and the functionality of each type of form.
Form configuration of a layer is about designing the form and establishing validation rules.
The interface of the form designer allows you to define the content and layout of the forms used to enter attributes and perform queries.
Forms are organized in a grid, and you can configure the number of rows and columns. Columns and rows can be added to the grid at any moment. All empty rows at the bottom of the form and empty columns at the right of the form will be automatically eliminated when the form is saved.
Each cell of the grid can contain a component of the form (label, text entry field, value list, etc.) but each component can also span several cells horizontally.
Each form can have one or more sections. The user can move from one section to another within a form. This can be especially useful if the form is long or complex.
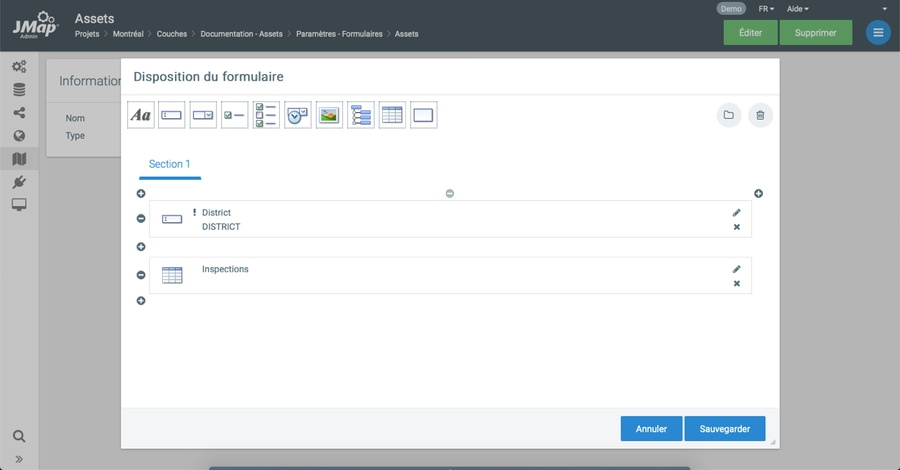
The following image shows the main parts of the form designer.
1
Drag a component to a cell in the form. All available cells are highlighted.
2
3
These tabs allow you to access the different sections.
4
5
6
7
Most form components must be associated with either a layer attribute, a database field or a search criterion, depending on the type of form created. The Label, Photo, and Group components are exceptions to this rule.
Each type of component has its own configuration window. The settings allow you to control the behavior and appearance of the component. The following table describes some of the settings that are common to several components. A comprehensive description of available components is provided further below.
Attribute
Select the layer attribute or the query variable to which this component is associated. This is the attribute or variable that the form component will provide.
Required
Read only
Select this option to make this a read-only component. The user will not be able to modify the content. This option should be used to modify a component with a default value.
Column span
By default, each component occupies only one cell. For a component that spans several cells horizontally, enter the number of cells the component will span. Cells occupied by a spanned component are labeled Spanned.
Tooltip
This text is displayed in a tooltip when the user places the mouse pointer on this component.
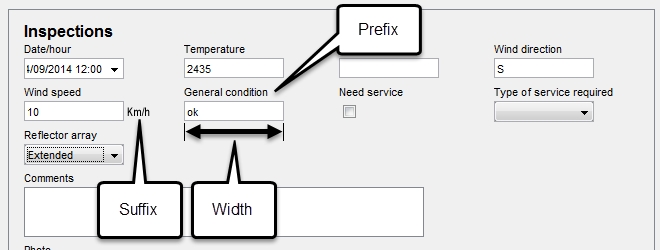
Label (prefix)
Enter static text that will appear above the component.
Label (suffix)
Enter static text that will appear on the right of the component.
Width (pixels)
Specify the width in pixels of the component entry field, excluding the suffix label. The default value is 100. The width of each column of the form will automatically be the same as the widest component in the form.
Default value
The following table describes the various components available to create forms and their specific settings. Note that some components are not available to create attribute queries.
Label
Static text to be displayed in the form.
Text
A field used to enter an alphanumeric value. The associated field must be alphanumeric or numeric. Input mask: An input mask can be used to control the format of the value entered. Multiline: (alphanumeric fields only) If this option is enabled, the entry field will cover several lines of text, making it easier to enter longer text. Max. number of characters: (alphanumeric fields only) Determines the maximum length of the text a user can enter. This must comply with the restrictions of the database field containing the data. Range validation: (numeric fields only): Allows you to define a range of accepted values (e.g. from 0 to 100).
List (single choice)
A list of values from which only one value can be selected.
The associated field must be numeric or alphanumeric.
The values in the list can be provided in several different languages if your project supports multiple languages. The list can be dynamic, which means its content can be modified dynamically based on the selection of a value from another list. For instance, when selecting a country in a list, another list will be refreshed dynamically to display only the cities of the selected country. Parent attribute If the list must be dynamic, select the parent attribute. In order to link list B (child) to a list A (parent), you must begin by selecting the parent attribute for list B (the attribute associated to list A).
If there is a change in the value selected in list A, the content of list B will be updated.
The values of list B are determined by the relationship between its values and the values of the parent attribute.
If list B has only one value, it is selected automatically.
The values in the list can be entered manually or they can be taken from a database or another source: Values Enter the values in the space provided, indicating, for each one, the parent value (only if the list is dynamic), the value to use in the database and the label to display in the list.
This value will be used as the data.
The label is only used for the information the user will see.
If the value and the label are the same, enter the same value twice. If the list is not dynamic, leave the parent value blank. Get values from a database You must select the database from which you wish to obtain the values.
Afterwards, enter an SQL query that will be executed to obtain the parent values (only if the list is dynamic), the values, and the labels to be displayed. Normally, labels must be unique and sorted.
Example
List of countries, available in English and in French. This list is not dynamic. It is associated with a COUNTRY attribute.
select * from MY_TABLE where ITEM_TYPE = 'Country' order by ITEM_VALUE;
In this example, the ITEM_VALUE field contains the value, the ITEM_LABEL_EN field contains the name of the country in English, and the ITEM_LABEL_FR field contains the name of the country in French.
There is no parent value because the list is not dynamic (it does not have a parent list).
Example
List of cities, available in English and in French. This list is dynamic. Its parent attribute is COUNTRY, which is associated with the previous list. It lists the cities for the country selected in the parent list.
select * from MY_TABLE where ITEM_TYPE = 'City' order by ITEM_VALUE;
In this example, the ITEM_VALUE field contains the value, the ITEM_LABEL_EN field contains the name of the city in English, and the ITEM_LABEL_FR field contains the name of the city in French.
The PARENT_VALUE field contains the parent value.
Important: The SQL query of a child list must include the field that allows you to establish the relation with the parent values. The previous example used select to include all the fields in the queries.
Note: At times, values to be displayed in a list come from a table associated to a spatial data source stored in JMap Server’s System database. In such a case, the name of the physical table cannot be known. To solve this, you can use this simple approach: instead of entering the name of the table, enter the ID of the layer preceded by the acronym “DS” between dollar signs $.
Example
select distinct ID_CITY, CITY from $DS27$ order by CITY
Provider Other sources may be available to provide the values and labels. If this is the case, you can select this option and choose the source in the list of available sources.
List (multiple choices)
A value list from which one or more values can be selected.
The associated field must be alphanumeric.
The value saved in the field is the list of selected options, separated by commas (,). The values in the list can be entered manually or they can come from a database or another source.
Check box (true or false)
Populates the associated field for which there are only 2 possible values.
The 2 possible values must be specified and be character strings (e.g. true or false) or numerical values (e.g. 0 or 1).
If the associated field is boolean, you must use true and false. Checked value: Value to be recorded if the check box is selected. Unchecked value: Value to be recorded if the check box is not selected.
Calendar (single date)
Allows you to select a date.
The layer attribute or the field used for the query must be of one of the following types: date, datetime or timestamp. Date format: This is the format that the calendar component will use to display the selected date. If the user enters the date manually, he or she must also use this format (e.g. dd/MM/yyyy, yy/MM/dd H:ss, etc.).
This component allows the user to insert images in a form. In JMap Survey, it allows the user to take photos with the device’s integrated camera. In JMap Pro, JMap Web or JMap NG, the user can select existing images to insert in the form or in the subform.
This component cannot be present more than once in the same form or subform. For a layer attributes form, the photos can be stored in the JMap Server System database (in this case, no configuration is required) or in an external database.
When this component is added to a database form, the photos must be stored in an external database. You must then define all required parameters for storing the photos.
Storage:
Choose the JMap option to store the photos in JMap’s System database (only available for layer attribute forms). Photos selected by the users are copied in the JMAP_HOME\db\documents directory, and the relation between the layer element and the photo is added to the JMAP_DOCUMENTS table in the System database.
Note: Photo title field and Photo comment field are new features of JMap Server Istanbul. If you update your JMap Server Hanoï to JMap Server Lima, to allow JMap users to add a title and comments to photos, you must edit the forms to select the fields in the table that will respectively contain the title and comments of the photos.
Tree (tree of values)
This component displays a value tree structure with N levels. The user can select a value in the tree, leaf or branch.
This value will be stored in the associated attribute.
The associated attribute must be alphanumeric.
The values of the tree can be provided in several languages if your project supports multiple languages. The tree shows a parent-child data structure, like the dynamic lists that are linked to one another.
However, unlike dynamic lists, the tree is associated to just one attribute.
The tree’s values can be entered manually or they may come from a database or another source: Values Enter the values in the space provided as you build the tree structure. For each value entered, you can define the parent (or the root of the tree). Get values from a database You must select the database from which you wish to obtain the values. Afterwards, enter an SQL query that will be executed to get the values from a table with a parent-child relationship.
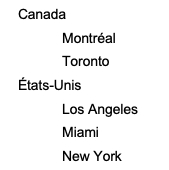
Example Tree containing countries (level 1) and cities (level 2), available in English and French.
select * from MY_TABLE;
In this example, the ITEM_VALUE field contains the value, the ITEM_LABEL_EN field contains the name of the country or city in English, and the ITEM_LABEL_FR field contains the name of the country or city in French.
The PARENT_VALUE field contains the parent.
With this configuration, JMap will build the following tree:
Allows you to manage data originating from databases external to JMap and for which a 1 to N relationship exists with the layer elements.
Example
Suppose a points layer represents fire hydrants in JMap (Assets), and a database external to JMap contains data on the inspections performed on these fire hydrants.
For each fire hydrant, 0, 1 or several inspections can be performed. In the attributes form (Assets form) of the fire hydrants layer, the table allows you to display inspection data regarding a fire hydrant, where each line in the table represents an inspection.
Depending on the permissions configured, the table can also be used to add, modify or delete the inspection data.
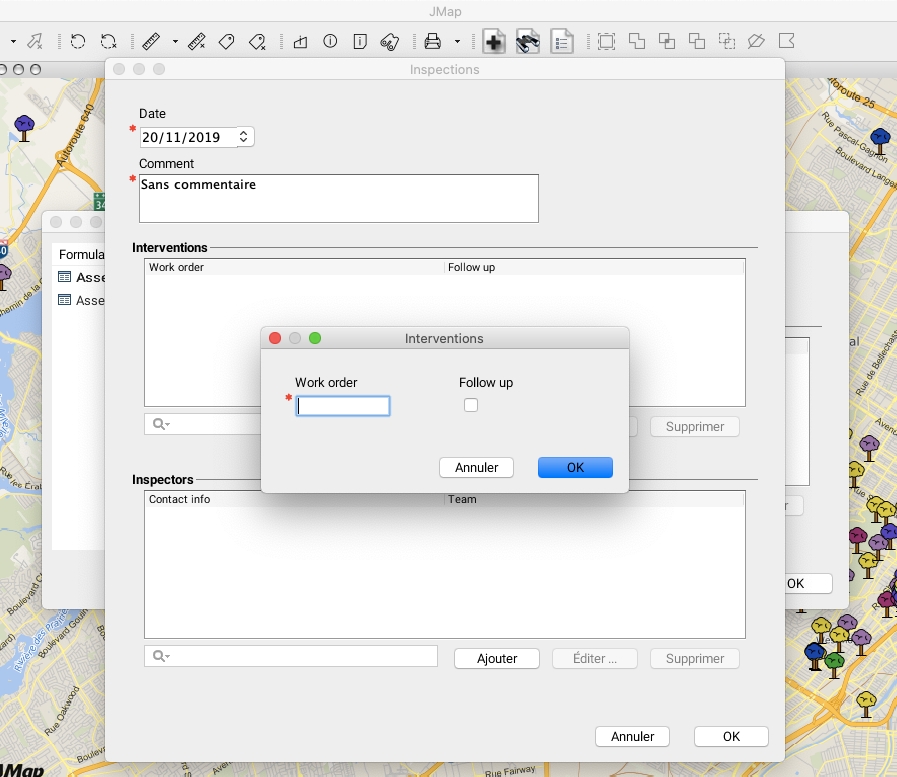
Subforms can be nested in a form or a subform. In the following example, each inspection can have 0, 1 or several interventions associated with it. In this case, the table displays the data of the interventions performed during each inspection.
The table is always associated with a subform. This subform defines how external data is accessed and allows this data to be entered. The subform must be created before the table can be configured.
Subform: Select an existing subform that will be used to populate the values associated with the table.
Fields: Allows you to manage the fields displayed in the table. These are the fields of the subform associated with the table. You can modify the field names, their display order, and their visibility in the table. It is also possible to modify the format of numeric and date fields. The table parameters allow you to define the external data fields that will be displayed in the table and their order of appearance.
Group (groups components together)
This component is used to group form components together.
A frame with a title will be drawn around the components belonging to the same group.
Insert this component in the cell of an empty row to start a new group. This component automatically spans all cells of the row.
ataIt cannot be inserted on a row that already has other components.
If you configure a database form you must ensure that the parameters of a component of the form are compatible with the characteristics of the corresponding field in the database.
For example, if a text field in the database is 50 characters long, the corresponding Text component of the form must have a maximum number of characters of 50.
The following functions can be used to initialize form components.
Functions
username()
Replaced by the user’s code.
fullname()
Replaced by the user’s full name.
date()
Replaced by the current date.
datetime()
Replaced by the current date and time.
uuid()
Replaced by a Universally Unique Identifier (UUID).
You can define validation rules for each component, in order to decrease errors when users of JMap applications enter values for the component. Rules can also be created at the form and subform level. The Form validation rules section presents this topic.
Only JMap Pro, JMap NG and JMap Survey applications take component validation rules into account. These rules are ignored in JMap Web applications.
The rules that you define at the component level allow in particular to:
Make a field “read-only” or “required” according to the values of other fields of the form.
Calculate the values of certain fields.
JMap uses JSonLogic, a programming language which allows to develop the syntax of the rules and to validate them because it offers evaluation libraries of logical expressions in all languages. You can build logical, mathematical or string expressions.
The rules at the component level allow three types of expressions:
Required
You can enter a Boolean expression that indicates when the field is required.
That is, if the expression you enter is respected (it is true), the field is mandatory.
The expression implies values from other fields on the form.
Example
{" == ": [{" var ":" STATUS "}," done "]}
This expression for the MATERIAL field, indicates that when the user enters the value “done” in the STATUS field, he must enter a value for the MATERIAL field to be able to save and close the form.
Note: This expression is exclusive with the Required parameter of the component. If you check the Required parameter, this field is always mandatory and the Required range to define a logical expression is not available. If you do not check the Required parameter and define a rule, the field becomes mandatory only when the rule is respected.
Read only
You can enter a Boolean expression that indicates when the field is in read-only mode.
That is, if the expression you enter is respected, the field is read-only.
The expression implies values from other fields on the form.
Note: This expression is exclusive with the Read only parameter of the component. If you check the Read only parameter, this field is always Read only and the Read only range to define a logical expression is not available. If you do not check the Read only parameter and define a rule, the field becomes Read only at the moment that the rule is respected.
Calculated
You can enter a mathematical or character strings expression to calculate the value of the field.
The result of this rule becomes the value of the field.
Example
{" * ": [2, 3.1416, {" / ": [{" var " : "DIAMETER"}, 2]}]}
This expression calculates the value of the CIRCUMFERENCE field from the value of the DIAMETER field.
Layer attribute forms and database forms and subforms allow you to define global form validation rules based on multiple fields. You can also define validation rules at the component level.
The rules validate the values of the fields on the client side, that is, the values that the users of JMap applications enter in the forms. The validation takes place when the form is saved, which is not done if the rules are not respected.
Only JMap Pro, JMap NG and JMap Survey applications take form validation rules into account. These rules are ignored in JMap Web applications.
To configure the rules of a form or a subform, open the configuration interface of the form or subform that interests you:
From a form's configuration interface, press the Rules button. The interface displays a table of the rules configured for the form.
Press Create to create a new rule or press a rule name to edit it.
Name
Enter a name for the rule.
Expression
Message
Enter the error message that appears when the logical expression is False. You can enter the message in multiple languages.
Exemple
Fields MATERIAL, INSP_DATE and DIAMETER cannot be null or empty if STATUS is 'Done'
Press Save.
You can create multiple rules for the same form.
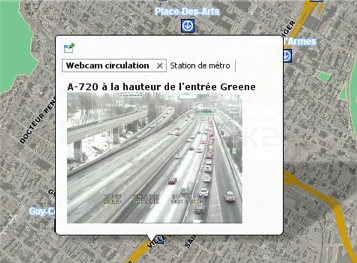
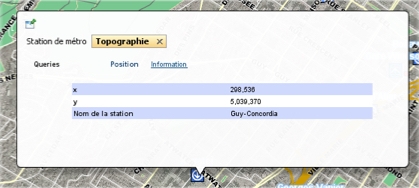
Mouseover bubbles are meant to display information about the elements they are pointing to. This information includes text, attribute values, hyperlinks, images, etc. The JMap administrator determines what information is displayed in the bubbles of each layer.
The content of mouseover bubbles can be formatted using HTML tags. Mouseover bubbles can also contain JavaScript programs.
The Mouseover tab of the layer configuration interface provides the tools to configure it.
Mouseover
Enter the content of the mouseover bubble. See sections below for an explanation of the syntax.
Background color
Select the background color of the mouseover bubble.
Prevent text duplication
Select this option to prevent the same text from being repeated many times within the same bubble. This can happen when pointing to many map elements on the same layer that have the same mouseover content (e.g. street segments at an intersection).
Minimum scale
Activate this option and enter the minimum scale from which the mouseover bubble must be displayed.
Maximum scale
Activate this option and enter the maximum scale from which the mouseover bubble must be displayed.
You must provide the text that will be used as the content of the bubble. This text can be comprised of static parts (displayed as is), variable parts (replaced at display time by another value), simple JavaScript programs, and HTML tags. For instance, the elementValue(city) function will be replaced at display time by the value of the city attribute for the pointed element.
The mouseover syntax is comprised of various functions that will determine the content of the bubbles. Functions and their parameters are generally not case sensitive. For instance, ev(city) is equal to Ev(CITY).
The following table explains the various available functions:
elementValue(attrib) or ev(attrib) attrib: the name of an attribute
Replaced by the value of the bound attribute whose name is passed as a parameter for the pointed element.
For example, ev(id) will be replaced by the value of the id attribute for this element.
elementId()
Replaced by the element identifier.
polygonArea()
Replaced by the area of a pointed polygon type element.
lineLength()
Replaced by the length of a pointed line type element.
centroid()
Replaced by the coordinates of the geometric centroid of the element's geometry.
format(attrib, format) attrib: the name of a date or numerical attribute format: the desired date format
ifNull(attrib, value) attrib: the name of the attribute to test value: the value to display if attrib is null
Replaced by the value value only if the value of the attrib attribute is null.
If the attribute value is not null, nothing is displayed.
Example
ifNull(temp, N/A)
Displays N/A if the value of the temp attribute is null.
Example
ifNull(attrib_a, attrib_b)
Displays the value of the attrib_b attribute if the value of the attrib_a attribute is null.
ifNotNull(attrib, value) attrib: the name of the attribute to test value: the value to display if attrib is not null
Replaced by the value only if the value of the attrib attribute is not null.
If the attribute value is null, nothing is displayed.
Example
ifNotNull(land_value, $)
Displays only if the value of land_value is not null.
subString(attrib, startIx, endIx) attrib: the name of the attribute for which a part must be extracted. startIx: starting position in the character string. endIx: ending position in the character string.
Replaced by a portion of the value (as a character string) of the attrib attribute, between the startIx position and endIx position.
Example
subString(name, 0, 5)
Replaced by the first five characters of the name attribute value. If this value is Montreal, the mouseover will display Montr.
encode(attrib, encoding) attrib: the name of the attribute to code encoding: the name of the encoding
Replaced by the value of the attrib attribute once it is encoded with the specified character encoding (UTF-8, CP437, ISO 8859-1, etc).
Example
encode(name, UTF-8)
Replaced by the value of the name attribute encoded in UTF-8 characters.
<script> code JavaScript</script>
Runs the JavaScript code found between the tags. In JavaScript, the attribute values of the elements are accessible through the elementValue() or ev() function.
Mathematical operations or character string operations can be performed on attribute values. To display content in the mouseover, the script must call on the print() function.
Example
<script>
print ( ev(population) / ev(area) );
</script>
Calculates and displays the result of the value of the population attribute divided by the value of the area attribute.
Example
<script>
var KM_IN_MI = 0.621371;
var dist_mi = ev(km) * KM_IN_MI;
print('ev(osm_name)');
print(dist_mi.toFixed(1) + " mi");
</script>
Converts the distance in kilometers contained in the value of the km attribute into miles.
Displays the value of the osm_name attribute and the distance in miles with a decimal figure.
<a href="download:file URL">some text</a>
JMap supports a special hyperlink syntax that allows a user to download a file by clicking on the link.
The file to download can come from a http: or a file: URL.
Example
<a href="download:http://someserver/123/report.pdf">Download</a>
Displays a link that can be used to download the report.pdf file from the web.
Example
<a href="download:file://D:/123/report.pdf">Download</a>
Displays a link that can be used to download the report.pdf file from a Windows file system folder.
photosAsThumbnails()
Replaced by smaller versions of the images attached to the element.
The user can click on a thumbnail to open the full size image.
photosAsThumbnails(title)
photosAsThumbnails(date)
photosAsThumbnails(title,date)
With these options, the title and/or date will be displayed with each thumbnail.
It is very important that you do not add any spaces between title, the comma, and date.
projectName()
Replaced by the name of the current project.
userName()
Replaced by the user code of the user that is currently connected.
sessionId()
Replaced by the identifier of the current session.
host()
Replaced by the name of the host or address of the JMap Server instance to which the application is connected.
port()
Replaced by the port number (http or direct) of the JMap Server instance to which the application is connected.
date()
Replaced by the current date and time.
The content of the bubble can be formatted using simple HTML tags. Mouseover bubbles do not support CSS or advanced tags such as <DIV>. The following HTML tags are supported and frequently used in mouseover:
<B>, <I>, <U>, <A>, <IMG>, <TABLE>, <BR>
You can insert hyperlinks in mouseover bubbles. These hyperlinks can be clicked, and they allow users to open HTML pages or to open or download files.
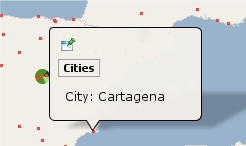
Mouseover content
Display
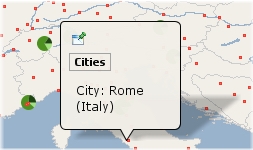
City : ev(CITY)
A simple example of static text with the value of an attribute.
City: ev(CITY)
(ev(COUNTRY))
Example containing static parts and displaying 2 attribute values on 2 lines.
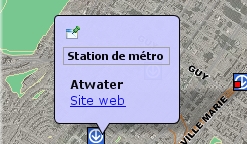
<b>ev(STATION_NAME)</b>
<a href="ev(URL)">Site web</a>
An example of basic formatting using HTML tags and a hyperlink where the URL comes from the value of the URL attribute.
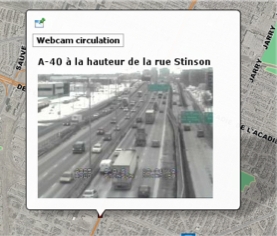
<b>ev(DESCRIPTION)</b>
<img src="ev(IMAGE_URL)" height="175" width="234" />
An example of an HTML tag that takes the image URL from the value of the IMAGE_URL attribute.
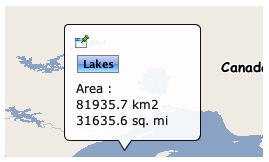
Area :
ev(AREA_KM2) km2
<script>
var SQ_KM_IN_SQ_MI = 2.58998811;
var area_sq_mi = ev(AREA_KM2) / SQ_KM_IN_SQ_MI;
print(area_sq_mi.toFixed(1) + " sq. mi");
</script>
An example of a <script> tag with JavaScript code.
The value of the AREA_KM2 attribute is converted from square kilometers to square miles.
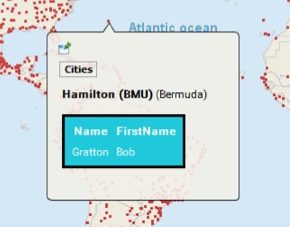
<table style="border:3px solid black; border-radius:5px; background: #1fc8db; color:white">
<thead> <tr> <th style="padding: 5px" class="">Name</th> <th style="padding: 5px" class="actions">FirstName</th></tr> </thead>
<tbody> <tr> <td style="padding: 5px" class="">Gratton</td> <td style="padding: 5px" class="actions">Bob</td> </tr> </tbody>
</table>
An example of formatting with a style attribute.
Mouseover supports a function to locate map coordinates or elements using a special URL syntax. A hyperlink is displayed in the bubble, and when it is clicked, the map locates the specified element(s) or region. This function is only available in JMap Pro.
Mouseover locate example
Description
<a href="locate:region;-73;45;5;5">Locate</a>
Displays a Locate hyperlink. When clicked, locates the region defined by x=-73, y = 45, width = 5, height = 5 in the same map. This is expressed in the map's units.
<a href="locate:object;subway;name;'atwater'">Locate</a>
Displays a Locate hyperlink. When clicked, locates the elements on the subway layer that have their attribute name equal to atwater in the same map.
<a href="locate:object;subway;name;'a%'">Locate</a>
Displays a Locate hyperlink. When clicked, locates the elements on the subway layer that have their attribute name starting with letter a in the same map.
<a href="locate:object;subway;name;'atwater';1000">Locate</a>
Displays a Locate hyperlink. When clicked, locates the elements on the subway layer that have their attribute name equal to atwater in the same map. The resulting map has a scale of 1 : 1000.
<a href="locate:object;subway;name;'atwater':target=Result">Locate</a>
Displays a Locate hyperlink. When clicked, locates, in a new map called Result, the elements on the subway layer that have their attribute name equal to atwater. If a map called Result already exists, it is reused. If the name of the map was new, a new map (with an automatically generated name) would be created each time.
You can specify a URL that opens an HTML page to display in the mouseover bubble (only supported in JMap Pro). The HTML page will occupy 100% of the bubble. The syntax is as follows:
$URL{http://awebsite.com}
The specified URL can be static or it can come from an attribute. It can also use attribute values as parameters, as shown below:
$URL{http://awebsite.com?param1=ev(ATTRIB_A)¶m2=ev(ATTRIB_B)}
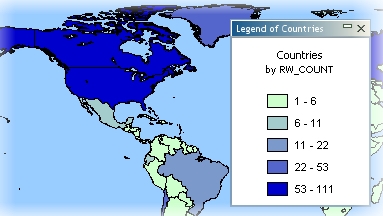
Thematic mapping is the production of maps to express information about a specific phenomenon. Examples of thematic maps include: polygons representing sectors of a city colored differently based on the crime rate of each sector; points representing cities displayed using different symbol sizes based on the population in the city, etc.
In JMap, you can create thematic maps using the bound attributes of a layer. Depending on the values of their attributes, map elements will then be displayed differently. Using JMap Admin, you can create as many thematic maps as you want and you can also create many thematics using the same layer.
JMap NG and JMap Survey apps do not support thematics with NULL values. Map elements with NULL values are not displayed in these applications. To solve this problem, you can replace the NULL value by NA, ND or another value.
In JMap, there are two main categories of thematics: and .
To create a thematic, press Create in the Thematics tab of the layer settings.
Thematics that use a classification will separate map elements into a finite number of categories (also called classes), each having a specific style. When a map element belonging to such a thematic is displayed, it uses the style of the category it is part of in order to render itself on the screen.
Graduated styles thematics use a graduation of one or more visual variables to represent the elements of the different categories. Examples of such graduations include: the fill color of polygons that is graduated from white to red, the size of point symbols that is graduated from size 1 to size 5, the line width of elements that is graduated from 1 to 4, etc. In all cases, there is a finite number of categories and every element of the layer falls into one of those categories. Only a numeric attribute can be used for this type of thematic.
To create a new thematic of this type, you need to select the numeric attribute to use, define the number of categories, select the range calculation method, and define the category styles.
The next section allows you to define the styles of the categories. There are two possibilities: create custom range styles or use predefined color schemes.
You must define the from and to values of the style by indicating the style variables that will vary (e.g. border thickness, symbol size, fill color, etc.). The category styles are then generated by interpolation between the from and to styles. Optionally, a third style can be used to create an inflexion point. If an inflexion is defined, the generated styles will pass through the inflexion point at the specified position in percentage. The interface is different based on the element type of the layer.
Instead of manually defining styles, you can select a color scheme to generate the styles of the thematic's categories.
Graduated symbols thematics draw symbols superposed on the elements they qualify. The symbol sizes are graduated according to a finite number of categories based on a numeric attribute. The symbols can be used with any type of map element. Only numeric attributes can be used for this type of thematic.
Individual values thematics represent all elements that have the same attribute value with the same style. This type of thematic is not using a range of values for each category but rather a specific value. The maximum number of unique different values is 512. If your layer has more different values, it will not be possible to create this type of thematic on that layer. Numeric and alphanumeric attributes can be used with this type of thematic.
To create a new thematic of this type, all you have to do is select the attribute to use and follow the steps of the thematic configuration wizard:
Individual custom values thematics are similar to individual values thematics except that you can define your own values, instead of being limited to values already present in the data. This is useful when you create thematics using a data set that does not contain all the known possible values for an attribute. When new data is later added to this data set, the new values will be handled properly by this type of thematic.
Proportional quantities thematics represent map elements using a continuous variation of a visual variable (e.g. symbol size, fill color, etc.) based on a numeric attribute or set of attributes.
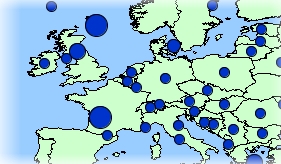
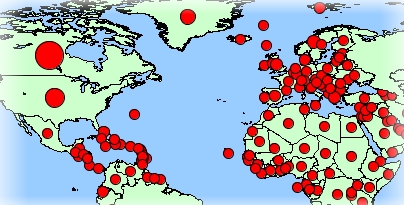
Proportional symbols thematics draw circular symbols superposed on the center of the elements they qualify. The symbol sizes are determined by interpolation between the minimum and maximum values of the attribute. Only numeric attributes can be used for this type of thematic.
To create a new thematic of this type, you need to select the numeric attribute to use and define the from and to styles. The symbol size and color will be interpolated between the from and to values.
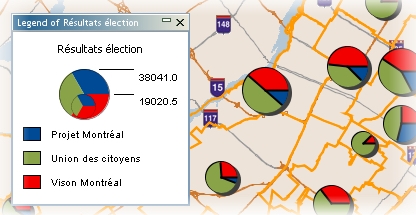
Pie charts thematics draw pie chart diagrams on the center of the elements they qualify. This type of thematic works with one or many numeric attributes. Each part of the diagram (piece of the pie) is associated with a different attribute. The size of the diagram is proportional to the sum of the attribute values. Only numeric attributes can be used for this type of thematic.
To create a new thematic of this type, you need to select one or more numeric attributes to use and define the chart style.
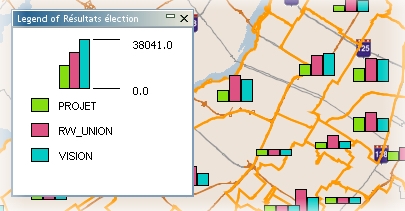
Bar charts thematics draw bar chart diagrams on the center of the elements they qualify. This type of thematic works with one or many numeric attributes. Each bar of the diagram is associated with a different attribute. The size of the diagram is proportional to the sum of the attribute values. Only numeric attributes can be used for this type of thematic.
Several different methods can be used to calculate the ranges of values for the categories of thematics using classifications. These methods are described below.
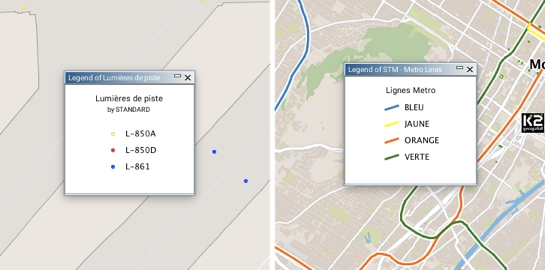
Once the thematic has been created, you are brought to the interface that displays its general information and that allows you to specify the legend, give titles to the classes, and edit or delete the thematic.
For classification thematics, you can unselect classes you do not want to display, and you can also give a title to each class.
Enabled thematics are displayed automatically when the layer is displayed in JMap on the client. Disabled thematics are still available but are not displayed by default. They need to be enabled by the user to be displayed. You can enable and disable thematics from the thematics section in JMap Admin.
In JMap Survey applications, the layers are displayed with the thematics enabled by default. The thematic legend is not displayed. Users cannot change the appearance of the layer.
In JMap applications, thematics are displayed in the order they are defined in JMap Admin. It is important to set the order appropriately because some thematics can completely hide others if they are placed on top. Use the Modify menu from the list of thematics in order to modify their order.
You can delete a theme by selecting it and pressing Delete.
These forms are used to enter the attribute values of an editable layer.
A layer can have only one attribute entry form.
The user must have the required permissions to modify the values of a layer’s attributes. Refer to the section for more information.
To create a form for entering attributes for a layer, in the Form section of the Forms tab of the layer configuration interface, press Create.
Enter a name for the new form. You must then select the type of form to create, Layer attributes. Click on Save.
Afterwards, select Form layout in the settings menu to go to the form designer and add components.
Each component of the form must be associated with an attribute of the layer.
The component provides the attribute value, and the value is updated when the user closes the form and saves the changes. Refer to the section for more information.
The Permissions button appears in the form configuration interface.
The Permissions section has two tabs: Permissions and Owners. The owners are the only ones who can manage the administrative permissions for the project, manage the list of owners and delete it.
The available permission is:
Some require the configuration of specific parameters at the layer level.
The layer configuration interface has tabs for each of the extensions that need to be configured at that level.
Once the settings are configured, press Save.
To provide your own images, place them in the following directory: JMAP_HOME/JMapAdmin/icons Supported image formats are svg, gif, png and jpeg. If subdirectories are created, they will be seen when browsing the image directory. This allows you to organize your image library. You can also upload new images by clicking on in the symbol selection window. The maximum image size is 100 Mb.
Current layer: Obtain report data directly in the layer attributes. Refer to . External database: Obtain report information from an external database connected to JMap. The database must contain a field that links to an attribute of the layer. Refer to .
Current layer: Obtain report data directly from layer attributes. Refer to . External database: Obtain report data directly from an external database connected to JMap. The database must contain a field that links to an attribute of the layer. Refer to .
Template used for reports on a single map element. Two templates are available: inforequest.rpttemplate: Basic template containing a table, arranged vertically. inforequestMap.rpttemplate: Similar to basic template but also contains a geographic map. Refer to .
Template used for reports on multiple map elements. Two templates are available: selectionreport.rpttemplate: Basic template containing a table, arranged horizontally. selectionreportMap.rpttemplate: Similar to basic template but also contains a geographic map. Refer to .
For example, if your report must be called by this URL:
http://myserver/reports/myreport?id=3then,
if the 0 attribute contains the parameter values, the following syntax must be used:
http://myserver/reports/myreport?id=%0
However, if your report can include information on a selection of multiple map elements, the parameter syntax can take one of two different forms. If your report must be called by the following URL:
http://myserver/reports/myreport?id=3,4,5then,
if the 0 attribute contains the parameter values, the following syntax should be used:
http://myserver/reports/myreport?%param[%0,'id',',']
This syntax uses the expression %param[Attribute, Parameter, Separator].
If your report must be called by this URL:
http://myserver/reports/myreport?id=3,id=4,id=5then,
if the 0 attribute contains the parameter values, the following syntax should be used:
http://myserver/reports/myreport?%param[%0,'id']
This syntax uses the expression %param[Attribute, Parameter]. It is also possible to include other variables to compose the URL, such as %f, %p, %u, %h, etc. Refer to for more information.
Replaced by a formatted number or date.
There are 2 possible formats:
%f[%n^D^dd/MM/yyyy]
where %n refers to an attribute containing a date, D indicates that we want to display a formatted date and dd/MM/yyyy is the format pattern, as indicated in the Java class documentation.
%f[%n^N^##0,00]
where %n refers to an attribute containing a number, N indicates that we want to display a formatted number and ##0,00 is the format pattern, as indicated in the Java class documentation.
Click on to create a new section, to delete an existing section or to rename a section. Click on to reset the entire form.
Click on the and buttons to insert empty rows or columns where required.
The symbol indicates that the component is in read-only mode.
The symbol indicates a required field.
The button allows you to modify the component's parameters. The button allows you to remove the component from the form.
Determines if this is a required field. The user cannot submit the form until all required fields have been populated. To make a field optional, you must unselect this option. Required fields are identified with a in the form designer.
Optionally enter a default value to initialize the data entry field. You can use certain to initialize the default value of a component.
The text’s alignment (left, right, center) can be specified, along with the font style used to display the text. Certain can be used in the label text.
The following examples use the MY_TABLE table.
Refer to List (single choice) for more information. Refer to section in Attribute Queries for more information about query configuration.
Photo (unavailable for )
Choose the External option to store the photos in the database or in the directory of your choice. The relation between the layer element and the photo is stored in the table and database of your choice. If you select External, you must define the entire configuration that follows. Delete photos with elements: Select this option if you want the photos associated with an element to be deleted automatically if the element is deleted. This option is not enabled by default. Database: Select the database where the photos must be stored. This database must be configured beforehand in JMap Admin. Table: Select the table that will contain the information on the photos. This table must have the following structure. The name of the table and fields may vary. The BLOB field is not required if the photos are stored on the drive and not in the database. Refer to the Photos persistence option for more details. Photo ID field: Select the field in the table that will contain the photo’s unique numerical identifier. Element ID field: Select the field in the table that will contain the attribute identifying the layer element. This attribute is called the key attribute and it is selected when the spatial data source associated with the layer is created. File name field: Select the field in the table that will contain the name of the file for the photos. Photo title field : Select the field in the table that will contain the photo’s title. Photo comment field : Select the field in the table that will contain the photo’s comment. This field contains 255 characters. Photos persistence: Choose the Database option to save the photos directly in the database, in a BLOB field existing in the table. You must then select the BLOB field. Choose the Disk option to save the photos in a folder of the server’s file system. You must then enter the photos folder that will contain the photo files.
The following example uses the MY_TABLE table.
Table (unavailable for )
The following figure shows the Assets form designer, with the Table component. This component is used to display the data from inspections, which is entered using the Inspections subform.
The following figure shows the design of the Inspections subform with the Table components. These components are used to display data on the interventions and inspectors, which is entered using the nested Interventions and Inspectors subforms.
For more information on using external data with JMap forms, refer to the section.
Enter the logical expression that defines the rule. The syntax is that of . You can enter logical and / or mathematical expressions.
The expression must be respected for the form to be validated and closed. The user of a JMap application (Pro, Survey, NG) must enter the correct data for the fields concerned by the expression in order the expression to be respected (is true) and the form can be saved and closed.
Exemple
{“!”:[
{“and”:[
{“==”:[{“var”:“STATUT”},“done”]},
{“or”:[
{“==”:[{“var”:“MATERIAL”},“”]},
{“==”:[{“var”:“INSP_DATE”}, null]},
{“==”:[{“var”: “DIAMETER”}, null]},
{“<=”:[{“var”:“DIAMETER”}, 0]}
]}
]}
]}
This expression indicates that when the value of the STATUS field is “done”, the MATERIAL, INSP_DATE and DIAMETER fields must be initialized (their value cannot be null or 0).
Note: Currently JMap cannot validate expressions that contain date type fields.
Replaced by a number or date that was formatted according to a specific format.
Example
format(date_insp, dd/MM/yyyy)
where date_insp is the name of an attribute containing a date and dd/MM/yyyy is the desired date format, as indicated in the documentation of the Java class.
Example
format(attrib, ##0,00)
where attrib is the name of an attribute containing a number and ##0,00 is the desired number format, as indicated in the documentation of the Java class.
/
There are several methods for calculating the ranges of values for the categories of this type of thematic. See for more information.
There are several methods for calculating the ranges of values for the categories of this type of thematic. See for more information.
The creation process is the same as for , as described above.
The creation process is similar to , except that you have the option to modify the list of individual values by adding, removing or modifying categories:
The creation process is similar to , as described above.
Click on to save the settings.
Click on to save the settings.
A list of users and groups with permissions appears in the Permissions tab. Click on to add new users or groups.
Available users and groups are configured in the JMap Server section of JMap Admin. Refer to the section for more information about managing users in JMap Server.
Attribute
Attribute
Select the numeric bound attribute to use.
Do not draw elements with out-of-sample values
If this option is selected, elements with values outside of the value range will not be displayed. This can happen when the data is modified after the thematic was created.
Create a category for null values
Select this option if you want null values to be represented in the thematic.
Categories
Categories
Enter the desired number of categories.
Range method
Select the method used to determine the bounds of the value ranges. Refer to Methods for calculating ranges for more information.
Remove duplicated categories
In some cases, several categories can have the exact same value limits. Select this option to avoid having identical categories. This can happen with very small data sets or if limits are rounded to big numbers.
Round at
Select the precision to use to round category range limits. It is often more useful to have rounded limits than very precise ones (e.g. country populations rounded to the nearest million).
Use inflexion point at
Select this option to use an inflexion point and specify the position of the inflexion.
Edit base style
Use this link to modify the style of the layer without leaving the Thematics section. The base style is used to produce the styles of the categories.
Type
3 types of color schemes are available: Sequential: The colors form a gradient of sequential colors (e.g. from white to red). Diverging: The colors form a gradient with a central color (e.g. from blue to white to red). Here emphasis is placed on central categories. Qualitative: Colors do not follow any sequence.
Reverse order
Check this box to reverse the order of the colors in the palette.
Apply to
You can choose to apply the palette to the available visual variables (e.g. fill, border, etc.), depending on the type of element on the layer.
Pie charts thematic
Attributes
Select one or more numeric attributes. Each attribute will be represented by a piece of the pie chart. The size of the chart will be determined by the sum of those attribute values.
Do not draw elements with out-of-sample values
If this option is selected, elements with values not present in the value sample will not be displayed. This can happen when the data is modified after the thematic was created.
Ignore negative values
Select this option to ignore negative values.
Pie chart style
Chart size
Select the from size (smaller) and the to size (bigger). The chart size will be determined by interpolation between these two values.
Border thickness
To draw a border around the chart, select a non zero border thickness.
Start angle
Select one of the directions to use as the starting angle of the chart. The first piece of the pie chart will start at the specified angle.
Draw shadow
Select this option to draw a shadow for the pie charts.
Labels
Select the label type (or none) to indicate the value or relative percentage of each piece of the pie chart.
Colors
Select the color of each portion of the pie chart.
Equal ranges
The ranges will have equal sizes between the minimum and the maximum values (e.g. 0-10,10-20, 20-30).
Equal count
The range limits will be calculated so that an equal count of elements falls in each category.
Standard deviation
The range limits will be calculated so that the average value falls in the middle of the categories and each category range size is equal to the calculated standard deviation value.
Defined interval
The range size is user-defined and constant for all categories, starting from the minimum value, and adding the defined interval for each category.
Percent ranges
The range for each category is expressed as a percentage of the full value range (e.g. 4 categories with 20%, 20%, 35% and 25%). The total must be equal to 100%.
Custom ranges
All range limits are user-defined.
Legend title
Enter a title for the legend.
Legend subtitle
Enter a subtitle for the legend.
Dynamic legend
For classification thematics only. Select this option to make the legend dynamic. This type of legend is constantly refreshed to show only the classes that are visible on the map displayed.
Symbols in the legend
For proportional quantities thematics only. Select the number of symbols you want to display in the legend. The minimum is 2 symbols indicating the extreme values.
Modify attribute values
Allows a user or group to use the form to modify values of layer attributes.
Attribute
Attribute
Select the bound attribute to use. It can be numeric or alphanumeric.
Do not draw elements with out-of-sample values
If this option is selected, elements with values not present in the value sample will not be displayed. This can happen when the data is modified after the thematic was created.
Create a category for null values
Select this option if you want null values to be represented in the thematic.
Categories
Sort the categories in ascending or descending order.
Style
Base style
You can select the basic style of the thematic.
Colors Schemes
Select Allows you to select a predefined color scheme.
Nulle value style
Allows you to select the style for the null value category (elements in the layer with a null value for the attribute).
Value
Allows you to filter a category value. This is useful when you have a thematic with many categories.
Style
Allows you to define a style for each category. You can use a style template.
Attribute
Attribute
Select the bound attribute to use. It can be numeric or alphanumeric.
Do not draw elements with out-of-sample values
If this option is selected, elements with values not present in the value sample will not be displayed. This can happen when the data is modified after the thematic was created.
Create a category for null values
Select this option if you want null values to be represented in the thematic.
Categories
Values
Sort the categories in ascending or descending order.
Style
Base style
You can select the basic style of the thematic.
Colors Schemes
Select Allows you to select a predefined color scheme.
Nulle value style
Allows you to select the style for the null value category (elements in the layer with a null value for the attribute).
Value
Allows you to filter a category value. This is useful when you have a thematic with many categories.
Style
Allows you to define a style for each category. You can use a style template.
Name
Enter a unique name for the thematic. This name will be visible by users.
Description
You can provide a description for the thematic.
Type
Select the type of thematic you wish to create. The following steps will depend on the type of thematic you have chosen.
Database forms are used to manage data stored in databases that are external to JMap. They allow you to add new data as well as modify or delete existing data.
You can create several database forms for one layer.
Each database form has its own permissions to control which users can make changes to the data.
These forms can be used to manage data using a 1 to 1 relationship with a layer’s data. In this case, a record is added when an element is created, and this record is usually deleted when the element is deleted.
They can also be used to manage data using a 1 to N relationship with the layer data. In this case, a special type of form called a subform is used and is always associated with a table form component. Refer to the subforms section for more information on this topic.
Configuring this type of form is an advanced JMap function that requires writing SQL queries to extract, add, modify and delete data.
To create a database form, in the Form section of the Forms tab of the layer configuration interface, press Create.
You must enter a name for the new form. Afterwards, you must select the type of form to create, Database, then select the database containing the data to be used in the forms.
At the following step, a window allows you to enter the form’s SQL queries. These queries are used to extract, add, modify, and delete data.
The SELECT query is required, but the others are optional.
Only operations for which SQL queries have been provided can be performed.
A special syntax is used for SQL query configuration. In general, each line of this syntax must end with a semicolon (;). The syntax is not case sensitive.
The following table provides a detailed explanation of how this syntax works.
ev(attrib) or elementValue(attrib)
This function returns the value of the attribute specified as a parameter for an element.
Example
ev(city);
Returns the value of the element’s CITY attribute.
fv(field) or formValue(field)
This function returns the value in the form for the field specified as a parameter.
The name of the table must be the prefix of the field name.
Example
fv(table.name);
Returns the value entered in the form component associated with the TABLE.NAME field of the database.
ei() or elementId()
This function returns the id of the element. It can be the jmap_id field, or another field, as configured in the spatial data source.
$variable
Allows you to create and initialize variables that can be used in the various expressions.
For the INSERT query of a form, a variable containing the unique identifier of the inserted record must be used.
Example
$city = EV(city);
Creates a $city variable initialized with the value of the element’s CITY attribute.
nti(table, field) or nextTableId(table, field)
This function returns the next value to use as a numeric identifier for the table and field specified as parameters.
The specified field must exist in the specified table and must be an integer field.
The function determines the maximum value existing in the table and returns this value incremented by 1 (max + 1).
This function is useful when adding a new record in the database when the table has a unique identifier.
Example
$id = nextTableId(inspections, inspection_id)
Creates and initializes a $id variable with the value of the next INSPECTION_ID identifier in the INSPECTIONS table. If the maximum value present is 100, the value returned is 101.
The following table provides a detailed explanation of each parameter in the database form creation window.
Database
Select the database containing the data that must be managed by the form.
SELECT query
The SQL query that provides the data used to populate the form fields.
All the fields that are returned by this query can be used to configure the form’s components and also within other queries defined in the form using the fv()function.
The query must contain a condition to link a layer attribute with a database field.
Example of a query for a database form (1 to 1):
SELECT * FROM ASSET_INFO WHERE ASSET_ID = EI();
In this example, all the fields of the ASSET_INFO table are obtained and available to configure the form components.
The ASSET_ID field is used to link towards the element of the ASSETS layer using the ei() function.
If the ei() function returns a value in text format, you must place the statement between apostrophes to view the value:
SELECT * FROM ASSET_INFO WHERE ASSET_ID = 'EI()';
Example of a query for a database form (1 to N):
Example with the Inspections subform:
SELECT * FROM INSPECTION WHERE ASSET_ID = EI();
In this example, all the fields of the INSPECTION table are obtained and available to configure the subform’s components. The ASSET_ID field is used to link towards the element of the ASSETS layer using the ei() function.
If the ei() function returns a value in text format, you must place the statement between apostrophes to view the value:
SELECT * FROM INSPECTION WHERE ASSET_ID = 'EI()';
Example with the Inspectors nested subform:
SELECT * FROM INSPECTOR WHERE INSPECTION_ID = FV(INSPECTION_ID);
In this example, all the fields of the INSPECTOR table are obtained and available to configure the subform’s components. The INSPECTION_ID field is used to link towards the element of the INSPECTION table using the fv(field) function.
Example with Interventions nested subform:
SELECT * FROM INTERVENTION WHERE INSPECTION_ID = FV(INSPECTION_ID);
In this example, all the fields of the INTERVENTION table are obtained and available to configure the subform’s components. The INSPECTION_ID field is used to link towards the element of the INSPECTION table using the fv(field) function.
Field of the unique identifier
The SELECT query must include a unique identifier field (numeric or alphanumeric). Select the field that must be used as a unique identifier.
Example of a query for a database form (1 to 1): ASSET_INFO.ASSET_ID
Example of a query for a database form (1 to N), Inspections subform: INSPECTION.INSPECTION_ID
Example of a query for a database form (1 to N), Inspectors nested subform: INSPECTOR.INSPECTOR_ID
Example of a query for a database form (1 to N), Interventions nested subform: INTERVENTION.INTERVENTION_ID
INSERT query
SQL query that inserts new data in the database.
Configure this query only if the form must allow records to be added to the database.
You must define a variable that contains the value of the unique identifier for the new record.
Example of a query for a database form (1 to 1):
$id = ei(); INSERT INTO ASSET_INFO (ASSET_ID, ASSET_YEAR, BRAND, ASSET_HEIGHT) VALUES (EI(), FV(ASSET_INFO.ASSET_YEAR), FV(ASSET_INFO.BRAND), FV(ASSET_INFO.ASSET_HEIGHT));
In this example, the data of the form is inserted in the ASSET_INFO table when the INSERT SQL query is executed. The values of the ASSET_INFO.ASSET_YEAR, ASSET_INFO.BRAND and ASSET_INFO.ASSET_HEIGHT fields are provided by the values entered in the form using the fv(field) function.
The value of the ASSET_INFO.ASSET_ID variable is provided by the ei() function.
Example of a query for a database form (1 to N):
Example with Inspections subform:
$id = nti(INSPECTION, INSPECTION_ID);
INSERT INTO INSPECTION (INSPECTION_ID, ASSET_ID, INSP_DATE, INSP_COMMENT) VALUES ($id, EI(), FV(INSPECTION.INSP_DATE), FV(INSPECTION.INSP_COMMENT));
In this example, a $id variable is created and initialized with the next value (max + 1) of the ID field from the INSPECTION table. The form data is inserted in the INSPECTION table when the SQL INSERT query is executed.
The values of the INSP_DATE and INSP_COMMENT fields are provided by the values the user entered in the subform using the fv(field) function.
The value of the INSPECTION_ID field is provided by the $id variable.
The value of the ASSET_ID field is provided by the ei() function.
Example with Inspectors nested subform:
$id = nti(INSPECTOR, INSPECTOR_ID);
INSERT INTO INSPECTOR (INSPECTOR_ID, INSPECTION_ID, CONTACT_INFO, TEAM) VALUES ($id, FV(INSPECTOR.INSPECTION_ID), FV(INSPECTOR.CONTACT_INFO), FV(INSPECTOR.TEAM));
In this example, a $id variable is created and initialized with the next value (max + 1) of the ID field from the INSPECTOR table. The form data is inserted in the INSPECTOR table when the SQL INSERT query is executed.
The values of the INSPECTION_ID, CONTACT_INFO and TEAM fields are provided by the values the user entered in the subform using the fv(field) function.
The value of the INSPECTOR_ID field is provided by the \$id variable.
Example with Interventions nested subform:
$id = nti(INTERVENTION, INTERVENTION_ID);
INSERT INTO INTERVENTION (INTERVENTION_ID, INSPECTION_ID, WORK_ORDER, FOLLOW_UP) VALUES ($id, FV(INSPECTION_ID), FV(INTERVENTION.WORK_ORDER), FV(INTERVENTION.FOLLOW_UP));
In this example, a $id variable is created and initialized with the next value (max + 1) of the ID field from the INTERVENTION table.
The form data is inserted in the INTERVENTION table when the SQL INSERT query is executed.
The values of the INSPECTION_ID, WORK_ORDER and FOLLOW_UP fields are provided by the values the user entered in the subform using the fv(field) function.
The value of the INTERVENTION_ID field is provided by the $id variable.
Variable with the ID of the new element ()
Select the variable containing the value of the unique identifier of the new record inserted in the table. It must be defined with the INSERT query. In order for your data to be recorded in the database (the photos, for example), you must define and select this variable.
Example of a query for a database form (1 to 1): $id
Example of a query for a database form (1 to N), Inspections subform: $id
Example of a query for a database form (1 to N), Inspectors nested subform: $id
Example of a query for a database form (1 to N), Interventions nested subform: $id
UPDATE query
SQL query that updates the data in the database. Configure this query only if the form must allow data to be updated. Example of a query for a database form (1 to 1):
UPDATE ASSET_INFO SET ASSET_YEAR = FV(ASSET_INFO.ASSET_YEAR), BRAND = FV(ASSET_INFO.BRAND), ASSET_HEIGHT = FV(ASSET_INFO.ASSET_HEIGHT) WHERE ASSET_ID = FV(ASSET_INFO.ASSET_ID);
In this example, the form data is used to update the ASSET_INFO table when the UPDATE SQL query is executed. The values of the ASSET_YEAR, BRAND, and ASSET_HEIGHT fields are provided by the values the user entered in the form using the fv(field) function.
The WHERE clause allows you to update the record containing the element’s unique identifier, ASSET_ID, also using the fv(field) function.
Example of a query for a database form (1 to N):
Example with Inspections subform:
UPDATE INSPECTION SET INSP_DATE = FV(INSPECTION.INSP_DATE), INSP_COMMENT = FV(INSPECTION.INSP_COMMENT) WHERE INSPECTION_ID = FV(INSPECTION.INSPECTION_ID);
In this example, the subform data is used to update the INSPECTION table when the UPDATE SQL query is executed. The values of the INSP_DATE and INSP_COMMENT fields are updated, and they are provided by the values the user entered in the form using the fv(field) function.
The WHERE clause uses the fv(field) function to retrieve the value of the record’s unique identifier.
Example with Inspectors nested subform:
UPDATE INSPECTOR SET CONTACT_INFO = FV(INSPECTOR.CONTACT_INFO), TEAM = FV(INSPECTOR.TEAM) WHERE INSPECTOR_ID = FV(INSPECTOR.INSPECTOR_ID);
In this example, the subform data is used to update the INSPECTOR table when the UPDATE SQL query is executed. The values of the CONTACT_INFO field are updated, and they are provided by the value the user entered in the form using the fv(field) function.
The WHERE clause uses the fv(field) function to obtain the value of the record’s unique identifier.
Example with Interventions nested subform:
UPDATE INTERVENTION SET WORK_ORDER = FV(INTERVENTION.WORK_ORDER), FOLLOW_UP = FV(INTERVENTION.FOLLOW_UP) WHERE INTERVENTION_ID = FV(INTERVENTION.INTERVENTION_ID);
In this example, the subform data is used to update the INTERVENTION table when the UPDATE SQL query is executed. The values of the WORK_ORDER and FOLLOW_UP fields are updated, and they are provided by the value the user entered in the form using the fv(field) function.
The WHERE clause uses the fv(field) function to obtain the value of the record’s unique identifier.
DELETE query
This SQL query deletes the data from the database.
Only configure this query if the form must allow data to be deleted.
Example of a query for a database form (1 to 1):
DELETE FROM ASSET_INFO WHERE ASSET_ID = FV(ASSET_INFO.ASSET_ID);
In this example, the record corresponding to the element’s ASSET_ID attribute value is deleted from the ASSET_INFO table using the fv(field) function to obtain the value of the element’s identifier.
Example of a query for a database form (1 to N):
Example with Inspections subform:
DELETE FROM INSPECTION WHERE INSPECTION_ID = FV(INSPECTION.INSPECTION_ID); DELETE FROM INTERVENTION WHERE INSPECTION_ID = FV(INSPECTION.INSPECTION_ID); DELETE FROM INSPECTOR WHERE INSPECTION_ID = FV(INSPECTION.INSPECTION_ID);
In this example, the record corresponding to the inspection’s unique identifier is deleted from the table using the fv(field) function to obtain the value of the identifier.
The records of the INTERVENTION and INSPECTOR nested subforms that correspond to the inspection’s unique identifier are also deleted from the table when the inspection is deleted.
Example with Inspectors nested subform:
DELETE FROM INSPECTOR WHERE INSPECTOR_ID = FV(INSPECTOR.INSPECTOR_ID);
In this example, the record corresponding to the inspector’s unique identifier is deleted from the table using the fv(field) function to obtain the value of the identifier.
Example with Interventions nested subform:
DELETE FROM INTERVENTION WHERE INTERVENTION_ID = FV(INTERVENTION.INTERVENTION_ID);
In this example, the record corresponding to the intervention’s unique identifier is deleted from the table using the fv(field) function to obtain the value of the identifier.
Subforms are database forms that are opened from a Table component that exists in another form. They are normally used to manage data that has a 1 to N relationship with the layer’s elements. They could be used to manage data for inspections on assets (N inspections can be associated to the same object), for example. They are configured similarly to the other database forms.
To create a subform, open the Subform tab on the Forms tab in the layer parameters menu, then click on Create.
You must enter a name for the new form and select the database containing the data to be used in the forms.
At the following step, you must configure the SQL queries of the subform, as explained above for the creation of a database form.
Several levels of subforms can be nested in a subform. They are used to manage data having a 1 to N relationship with the subform’s records. For example, they can be used to manage the data of interventions arising from an inspection performed on an asset (N interventions can be associated with 1 inspection).
A nested subform is opened from a Table component found in the subform it is associated with.
Creating a nested subform is done by following the same steps to create a subform. Examples of queries are displayed in the table of the Creating a database form section.
The following figure shows a preview of the nested subforms from our example, in JMap Pro.
Database forms have their own permissions. The Permissions button appears in the form configuration interface.
The Permissions section has two tabs: Permissions and Owners. The owners are the only ones who can manage the administrative permissions for the project, manage the list of owners and delete it.
Available users and groups are configured in the JMap Server section of JMap Admin. Refer to the Users and Groups section for more information about managing users in JMap Server.
Available permissions are described in the table below.
Add data
Allows a user or group to use the form to add new data in the database.
Modify data
Allows a user or group to use the form to modify existing data in the database.
Delete data
Allows a user or group to use the form to delete data existing in the database.
Enter the value of the category you want to add. Press to add the category.
A list of users and groups with permissions appears in the Permissions tab. Click on to add new users or groups.


